Why Build Your Own Progress Bar?
tqdm is the go-to library for progress bars in Python, but building one yourself has real advantages:
- Zero external dependencies (no
pip installneeded) - You learn how terminal control actually works
- Complete freedom to customize the display format
In this article, we will build a progress bar step by step, starting from carriage return basics and working up to ETA display, ANSI colors, and multi-bar support.
Carriage Return Basics
The core trick behind a progress bar is overwriting the same line in the terminal repeatedly. This is done with the carriage return character \r.
\r moves the cursor back to the beginning of the current line. By printing without a newline, we overwrite the previous output.
import time

for i in range(101):
    print(f"\r Processing... {i}%", end="", flush=True)
    time.sleep(0.05)
print()  # final newline
Three key points:
- Place
\rat the start of the string - Use
end=""to suppress the newline - Use
flush=Trueto force the buffer to flush immediately (without this, the display may not update)
A Basic Progress Bar
A plain percentage is boring. Let us draw an actual bar in the format [████████░░░░░░░░] 50% (50/100).
import sys
import time

def progress_bar(current, total, bar_length=30):
    fraction = current / total
    filled = int(bar_length * fraction)
    bar = "█" * filled + "░" * (bar_length - filled)
    percent = fraction * 100
    sys.stdout.write(f"\r[{bar}] {percent:5.1f}% ({current}/{total})")
    sys.stdout.flush()

# Usage
total = 100
for i in range(total + 1):
    progress_bar(i, total)
    time.sleep(0.03)
print()
Running this produces a live-updating display:
[█████████████████░░░░░░░░░░░░░] 56.0% (56/100)
We use sys.stdout.write instead of print because it does not add any extra newlines or spaces.
Adding ETA Calculation
For long-running tasks, knowing how much time is left makes a big difference. We can estimate the remaining time from the elapsed time and current progress.
import sys
import time

def format_time(seconds):
    """Format seconds as HH:MM:SS."""
    h = int(seconds // 3600)
    m = int((seconds % 3600) // 60)
    s = int(seconds % 60)
    return f"{h:02d}:{m:02d}:{s:02d}"

def progress_bar_eta(current, total, start_time, bar_length=30):
    fraction = current / total
    filled = int(bar_length * fraction)
    bar = "█" * filled + "░" * (bar_length - filled)
    percent = fraction * 100

    elapsed = time.time() - start_time
    if current > 0:
        rate = current / elapsed          # iterations per second
        remaining = (total - current) / rate
        eta_str = format_time(remaining)
        rate_str = f"{rate:.1f} it/s"
    else:
        eta_str = "--:--:--"
        rate_str = "-- it/s"

    sys.stdout.write(
        f"\r[{bar}] {percent:5.1f}% | ETA: {eta_str} | {rate_str}"
    )
    sys.stdout.flush()

# Usage
total = 200
start = time.time()
for i in range(total + 1):
    progress_bar_eta(i, total, start)
    time.sleep(0.02)
print()
Sample output:
[███████████████░░░░░░░░░░░░░░░] 50.0% | ETA: 00:00:02 | 49.8 it/s
When current == 0, we show a placeholder to avoid division by zero.
ANSI Color Support
Terminals support ANSI escape sequences for coloring text. Let us change the bar color based on progress.
Here are the main color codes:
| Code | Color |
|---|---|
\033[91m | Bright red |
\033[93m | Bright yellow |
\033[92m | Bright green |
\033[0m | Reset |
import os
import sys
import time

def get_color(fraction):
    """Return a color code based on progress (red -> yellow -> green)."""
    if fraction < 0.33:
        return "\033[91m"  # red
    elif fraction < 0.66:
        return "\033[93m"  # yellow
    else:
        return "\033[92m"  # green

RESET = "\033[0m"

def progress_bar_color(current, total, start_time):
    try:
        terminal_width = os.get_terminal_size().columns
    except OSError:
        terminal_width = 80

    # Estimate non-bar characters and compute bar length
    suffix = f" {current/total*100:5.1f}% | ETA: 00:00:00 | 000.0 it/s"
    bar_length = max(10, terminal_width - len(suffix) - 4)  # account for []

    fraction = current / total
    filled = int(bar_length * fraction)
    color = get_color(fraction)
    bar = color + "█" * filled + RESET + "░" * (bar_length - filled)

    elapsed = time.time() - start_time
    if current > 0:
        rate = current / elapsed
        remaining = (total - current) / rate
        eta_str = format_time(remaining)
        rate_str = f"{rate:.1f} it/s"
    else:
        eta_str = "--:--:--"
        rate_str = "-- it/s"

    percent = fraction * 100
    sys.stdout.write(f"\r[{bar}] {percent:5.1f}% | ETA: {eta_str} | {rate_str}")
    sys.stdout.flush()

# format_time is the same as in the previous section

total = 150
start = time.time()
for i in range(total + 1):
    progress_bar_color(i, total, start)
    time.sleep(0.02)
print()
os.get_terminal_size() returns the current terminal width, so the bar adapts dynamically. Resizing the window will not break the layout.
Multi-Bar Implementation
When running multiple tasks in parallel, you may want to stack progress bars vertically. This requires ANSI cursor movement:
\033[{n}A: move cursor up n lines\033[{n}B: move cursor down n lines
The idea is simple: print multiple lines, then move the cursor back up and overwrite them.
import sys
import time
import random

def format_time(seconds):
    h = int(seconds // 3600)
    m = int((seconds % 3600) // 60)
    s = int(seconds % 60)
    return f"{h:02d}:{m:02d}:{s:02d}"

def get_color(fraction):
    if fraction < 0.33:
        return "\033[91m"
    elif fraction < 0.66:
        return "\033[93m"
    else:
        return "\033[92m"

RESET = "\033[0m"

def render_bar(label, current, total, start_time, bar_length=25):
    """Generate the string for a single progress bar."""
    fraction = current / total if total > 0 else 0
    filled = int(bar_length * fraction)
    color = get_color(fraction)
    bar = color + "█" * filled + RESET + "░" * (bar_length - filled)

    elapsed = time.time() - start_time
    if current > 0:
        rate = current / elapsed
        remaining = (total - current) / rate
        eta_str = format_time(remaining)
    else:
        eta_str = "--:--:--"

    percent = fraction * 100
    return f"{label}: [{bar}] {percent:5.1f}% ({current}/{total}) ETA: {eta_str}"

def multi_progress(tasks):
    """Display progress bars for multiple tasks."""
    n = len(tasks)
    start_times = [time.time() for _ in range(n)]
    progress = [0] * n
    totals = [t["total"] for t in tasks]
    labels = [t["label"] for t in tasks]

    # Initial render: reserve lines
    for i in range(n):
        print(render_bar(labels[i], 0, totals[i], start_times[i]))

    while any(progress[i] < totals[i] for i in range(n)):
        # Move cursor up n lines
        sys.stdout.write(f"\033[{n}A")

        for i in range(n):
            if progress[i] < totals[i]:
                step = random.randint(1, 3)
                progress[i] = min(progress[i] + step, totals[i])
            line = render_bar(labels[i], progress[i], totals[i], start_times[i])
            # Clear to end of line, then newline
            sys.stdout.write(f"\r{line}\033[K\n")

        sys.stdout.flush()
        time.sleep(0.1)

# Usage
tasks = [
    {"label": "Download ", "total": 100},
    {"label": "Extract  ", "total": 80},
    {"label": "Install  ", "total": 120},
]
multi_progress(tasks)
When running, the terminal displays something like this:
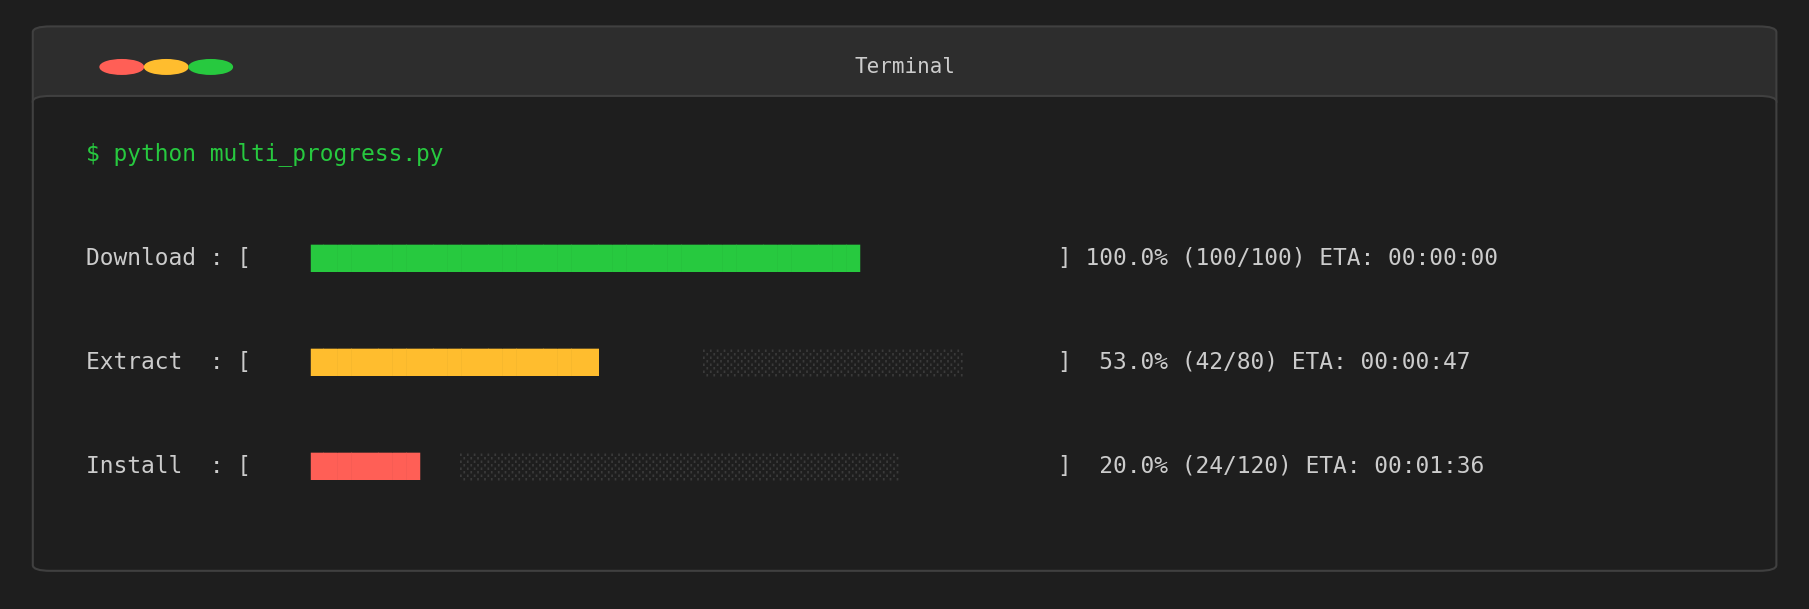
\033[K clears from the cursor to the end of the line. This prevents leftover characters when the bar gets shorter than the previous render.
Putting It Together: ProgressBar Class
Here is a complete class that combines everything we have built.
import os
import sys
import time

class ProgressBar:
    def __init__(self, total, label="Progress", bar_length=None, color=True):
        self.total = total
        self.label = label
        self.color = color
        self.current = 0
        self.start_time = None

        if bar_length is None:
            try:
                self.bar_length = max(10, os.get_terminal_size().columns - 60)
            except OSError:
                self.bar_length = 30
        else:
            self.bar_length = bar_length

    def _get_color(self, fraction):
        if not self.color:
            return ""
        if fraction < 0.33:
            return "\033[91m"
        elif fraction < 0.66:
            return "\033[93m"
        return "\033[92m"

    def _format_time(self, seconds):
        h = int(seconds // 3600)
        m = int((seconds % 3600) // 60)
        s = int(seconds % 60)
        return f"{h:02d}:{m:02d}:{s:02d}"

    def update(self, n=1):
        if self.start_time is None:
            self.start_time = time.time()

        self.current = min(self.current + n, self.total)
        fraction = self.current / self.total
        filled = int(self.bar_length * fraction)
        color = self._get_color(fraction)
        reset = "\033[0m" if self.color else ""
        bar = color + "█" * filled + reset + "░" * (self.bar_length - filled)

        elapsed = time.time() - self.start_time
        if self.current > 0:
            rate = self.current / elapsed
            remaining = (self.total - self.current) / rate
            eta_str = self._format_time(remaining)
            rate_str = f"{rate:.1f} it/s"
        else:
            eta_str = "--:--:--"
            rate_str = "-- it/s"

        percent = fraction * 100
        line = f"\r{self.label}: [{bar}] {percent:5.1f}% | ETA: {eta_str} | {rate_str}"
        sys.stdout.write(line + "\033[K")
        sys.stdout.flush()

    def finish(self):
        self.update(0)
        print()

# Usage
bar = ProgressBar(total=100, label="Training")
for i in range(100):
    time.sleep(0.03)
    bar.update()
bar.finish()
Sample output:
Training: [██████████████████████████████] 100.0% | ETA: 00:00:00 | 32.8 it/s
This class is about 60 lines and covers the core functionality of tqdm. You can extend it further by adding a context manager (__enter__ / __exit__) or an iterable wrapper for even more convenience.
Practical tqdm Variants: tqdm.tqdm, tqdm.notebook, tqdm.auto
Building your own bar is great for learning terminal control, but in production code reaching for tqdm is almost always the better call. tqdm ships several implementations tuned for different execution environments.
# Standard terminal implementation
from tqdm import tqdm
for x in tqdm(range(1000), desc="train"):
    ...

# Jupyter Notebook variant (HTML-based widget)
from tqdm.notebook import tqdm as tqdm_nb
for x in tqdm_nb(range(1000), desc="epoch"):
    ...

# Auto-detect: works whether you run in a CLI, Notebook, or IPython
from tqdm.auto import tqdm
If you are writing a library or shared script, prefer from tqdm.auto import tqdm. Under Jupyter it transparently delegates to tqdm.notebook; in a terminal it falls back to the plain implementation. No more “the bar renders as 50 carriage-return lines in my notebook” bug reports.
Custom Output with bar_format
The bar_format argument uses Python str.format syntax to give you full control over the display template. This is especially handy when you want to log structured training metrics inline.
from tqdm import tqdm

fmt = "{l_bar}{bar:30}{r_bar} | loss={postfix[0]:.4f}"
with tqdm(range(200), bar_format=fmt, postfix=[0.0]) as pbar:
    for step in pbar:
        loss = 1.0 / (step + 1)
        pbar.postfix[0] = loss
        pbar.update(0)  # refresh display without advancing
Useful placeholders:
| Placeholder | Meaning |
|---|---|
{l_bar} | Description plus percentage |
{bar:N} | The bar body, width N |
{r_bar} | Count plus elapsed, ETA, and rate |
{n_fmt} / {total_fmt} | Current / total (auto K/M formatting) |
{rate_fmt} | “12.5it/s” or “800ms/it” depending on speed |
{elapsed} / {remaining} | Elapsed / remaining wall-clock time |
{postfix} | Whatever you set via set_postfix(loss=0.12, ...) |
set_postfix is the idiomatic way to surface live training metrics next to the bar:
for x in (pbar := tqdm(range(N))):
    pbar.set_postfix(loss=f"{loss:.3f}", acc=f"{acc:.3f}")
Nested Bars with leave=False and position
For nested loops (outer epoch, inner batch) the canonical pattern combines position and leave=False.
from tqdm import tqdm

for epoch in tqdm(range(EPOCHS), desc="epoch", position=0):
    for batch in tqdm(range(N_BATCH), desc="batch",
                      position=1, leave=False):
        ...
leave=False on the inner bar means that line disappears once the inner loop finishes, keeping the screen tidy. If you spawn workers, share a lock via tqdm.set_lock(RLock()) and assign distinct position values so concurrent processes do not clobber each other’s rows.
tqdm.contrib.concurrent.process_map: A Direct Win for Parallel Work
Parallel computation is exactly where progress visibility matters most, which lines up with the other long-running workloads on this blog: Bayesian optimization, genetic algorithms, simulated annealing, and Monte Carlo simulations. tqdm.contrib.concurrent provides high-level wrappers around ProcessPoolExecutor and ThreadPoolExecutor with a built-in bar.
from tqdm.contrib.concurrent import process_map, thread_map

def heavy(seed):
    # one expensive trial (e.g., a Monte Carlo sample)
    ...
    return result

# CPU-bound: process pool
results = process_map(heavy, range(10_000), max_workers=8, chunksize=20)

# I/O-bound: thread pool
results = thread_map(fetch, urls, max_workers=32)
chunksize=1 gives fine-grained progress at the cost of per-task overhead. For ten-thousand-item workloads, chunksize=20 to 100 strikes a reasonable balance.
pandas Integration: df.progress_apply
A single call to tqdm.pandas() patches DataFrame.apply, groupby.apply, and Series.map to add progress_apply / progress_map siblings.
import pandas as pd
from tqdm import tqdm
tqdm.pandas(desc="feature")

df["price_log"] = df["price"].progress_apply(lambda x: math.log1p(x))

df.groupby("user_id").progress_apply(extract_features)
This single line removes the “is the kernel still alive?” anxiety from feature engineering scripts. I keep it in the default imports of every notebook.
tqdm vs rich.progress vs alive-progress
The rich ecosystem has produced credible alternatives in recent years. Here is a side-by-side comparison.
| Aspect | tqdm | rich.progress | alive-progress |
|---|---|---|---|
| Dependency footprint | Tiny (pure Python, no deps) | Medium (whole rich package) | Small |
| Multi-bar support | Manual position management | Native via Progress context | Spinner-pair friendly |
| Coloring | Raw ANSI, full control | Style DSL ([bold red]) | Rich animations |
| Jupyter support | tqdm.notebook (HTML widget) | rich.jupyter integration | Limited (CLI focused) |
| pandas integration | tqdm.pandas() one-liner | None (you must wrap manually) | None |
| Parallel-work helpers | tqdm.contrib.concurrent | Manual Progress.add_task | None |
| Coexisting with log output | Tricky (interleaved lines) | Smooth via Console.log | Auxiliary print helper |
| Sweet spot | ML / data pipelines, default choice | Building polished TUIs and CLIs | Personal projects, playful CLI feedback |
Rules of thumb:
- Large ETL pipelines or ML training loops ->
tqdm.auto+tqdm.pandas+process_map. - Distribution-grade CLI tools ->
rich.progressfor cohesive styling. - Hobby scripts where you want delight ->
alive-progress.
Measuring the Real Overhead
Everything above was a feature comparison. Few people have actually measured how much slower a progress bar makes your code. Using time.perf_counter(), we ran a trivial 1,000,000-iteration loop (accumulating (i * i) % 97) with no progress bar, with tqdm, with rich.progress, and with alive-progress, and measured wall-clock time for each.
Test environment: Apple M1, Python 3.14.6, tqdm 4.69.0, rich 15.0.0, alive-progress 3.3.0. Output was written to a redirected plain file rather than an interactive terminal (the same “non-TTY” situation covered in Edge Case 2 below). Each configuration ran 5 times; we report the median. Timing benchmarks are inherently machine-dependent, so treat these as relative trends rather than universal constants.
import time

N = 1_000_000

def trivial_step(i, total):
    return total + (i * i) % 97

def baseline(n):
    total = 0
    for i in range(n):
        total = trivial_step(i, total)
    return total

t0 = time.perf_counter()
baseline(N)
t1 = time.perf_counter()
print(f"baseline: {t1 - t0:.3f}s")  # -> baseline: 0.065s
For tqdm we compared default settings (for i in tqdm(range(n))), a forced synchronous-refresh mode (mininterval=0, miniters=1, refreshing and flushing on every single call), and a manually throttled mode (calling pbar.update(1000) once every 1,000 iterations). For rich.progress we compared the default (refresh_per_second=10) against a near-per-iteration refresh rate (refresh_per_second=1000). alive-progress used its default settings (force_tty=True so the animation stays enabled even without an attached tty). As a reference point we also re-measured the hand-rolled DIY bar (sys.stdout.write + flush()) from earlier in this article under the same conditions.
| Configuration | Time for 1M iterations | vs. baseline |
|---|---|---|
| baseline (no progress bar) | 0.065 s | — |
| DIY bar: throttled (write+flush every 1000) | 0.083 s | +27.8% |
tqdm: manual throttle (update() every 1000) | 0.098 s | +50.9% |
tqdm: default settings | 0.135 s | +108.2% |
alive-progress: default | 0.713 s | +997.6% |
rich.progress: default (10 Hz) | 0.729 s | +1022.0% |
rich.progress: refresh_per_second=1000 | 0.733 s | +1027.1% |
| DIY bar: naive (write+flush every iteration) | 2.157 s | +3218.7% |
tqdm: mininterval=0 (synchronous flush every iter) | 18.99 s | +29116.0% |
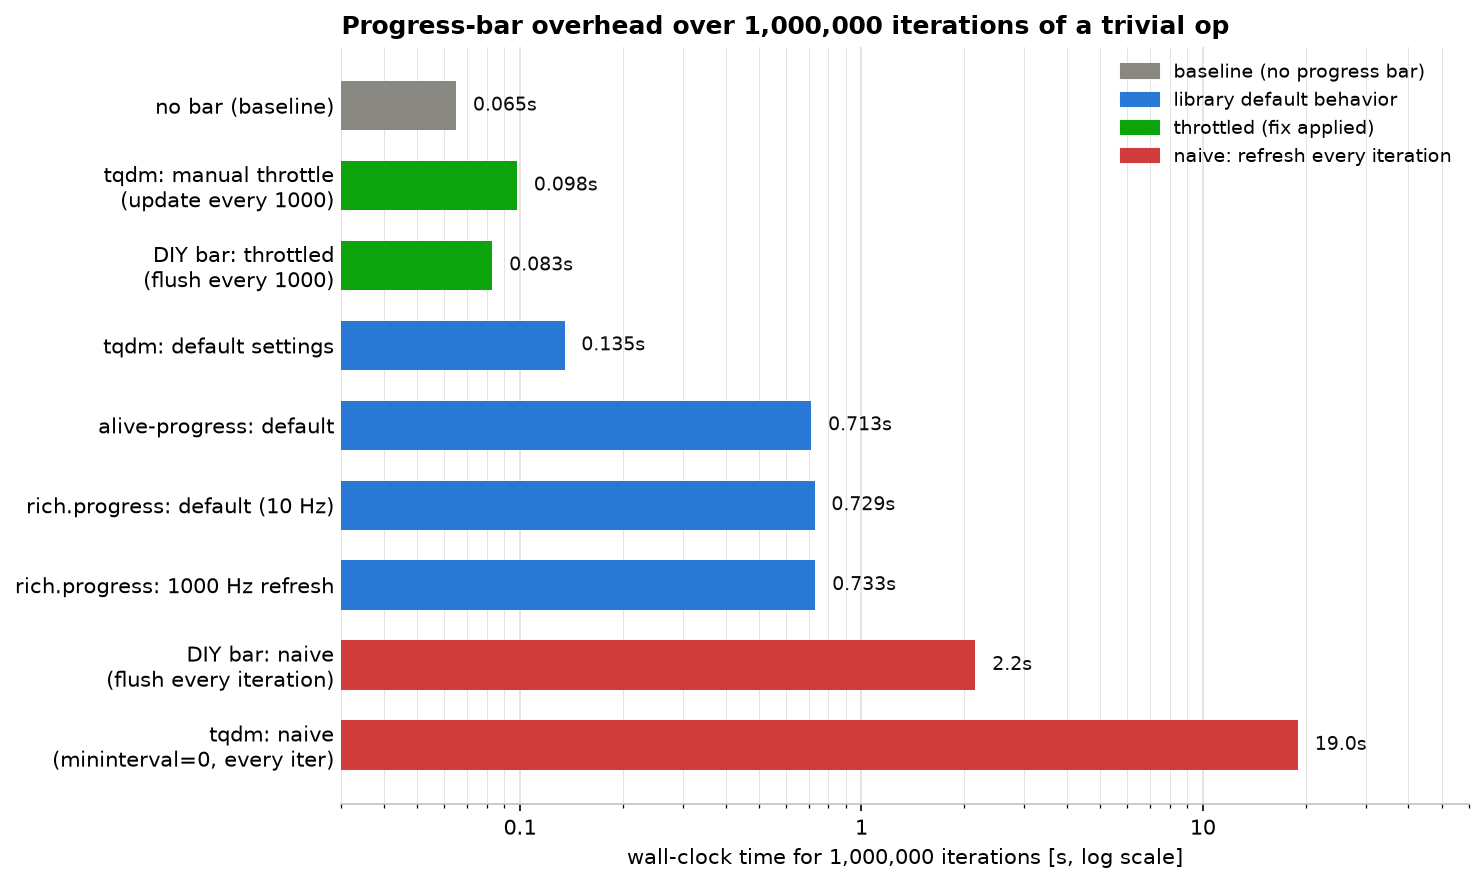
A few findings stand out:
tqdm’s default is remarkably cheap (+108%, about 0.07 microseconds/iteration). This is becausetqdminternally skips a refresh unless at leastmininterval(default 0.1s) has elapsed since the last one (dynamic_miniters).- Setting
mininterval=0makestqdmroughly 140x slower (0.135s -> 18.99s). This is the measured cost of the common “copy-pasted-from-a-forum” anti-pattern of settingmininterval=0to “make the bar feel smoother.” rich.progressandalive-progressbarely change whenrefresh_per_secondgoes from 10 to 1000 (0.729s -> 0.733s). This reflects an important architectural difference, explained below.- Manual throttling (updating once per 1,000 iterations) recovers almost all of
tqdm’s lost performance (+50.9%, about 0.033 microseconds/iteration).
Why Frequent Updates Are Slow: I/O, Flush Cost, and Architecture
The 140x slowdown from mininterval=0 comes from the fact that every single update() call now synchronously performs:
- Recomputing elapsed time, rate, and ETA (string formatting inside
format_meter) - Rebuilding the bar string (expanding
{bar},{postfix}, and other template placeholders) - Calling
sys.stdout.write()(a system call) - Calling
sys.stdout.flush()(forcing the buffer out to the OS immediately)
flush() is the most expensive of these. Ordinarily, print/write calls are buffered and batched before reaching the OS, but flush() forces a kernel write on every call, so you pay the full system-call overhead (including a context switch) a million times over. Indeed, the hand-rolled “flush on every iteration” DIY bar from earlier in this article – which does almost no string formatting – was already about 33x slower than baseline (2.157s). tqdm piles formatting cost on top of that, landing at roughly 292x slower.
By contrast, rich.progress and alive-progress barely reacted to the refresh_per_second change because they decouple “advance the progress state” from “repaint the screen” at the architecture level. Progress.update() merely increments an internal counter – cheap, in-process work – while the actual repaint is handled by a background thread on a fixed refresh_per_second cadence. So calling update() a million times only triggers, at most, roughly elapsed_seconds x refresh_per_second actual system-call-bearing redraws. tqdm, in contrast, synchronously decides “should I redraw right now?” inside the update() call itself, and if so, performs the write+flush on the spot. That means tqdm requires the caller to throttle explicitly, while rich/alive-progress get some protection from their design by default (though the pure per-call Python overhead of a million calls is still there, which is why both sit at roughly +1000% over baseline regardless of refresh rate).
Measuring how much throttling recovers. We swept tqdm’s update batch size (how many iterations pass between calls to update()) from 1 to 50,000 and measured total time for 1,000,000 iterations.
from tqdm import tqdm

def run(n, batch):
    total = 0
    with tqdm(total=n, mininterval=0, miniters=1) as pbar:
        count = 0
        for i in range(n):
            total += (i * i) % 97
            count += 1
            if count >= batch:
                pbar.update(count)
                count = 0
        if count:
            pbar.update(count)
    return total
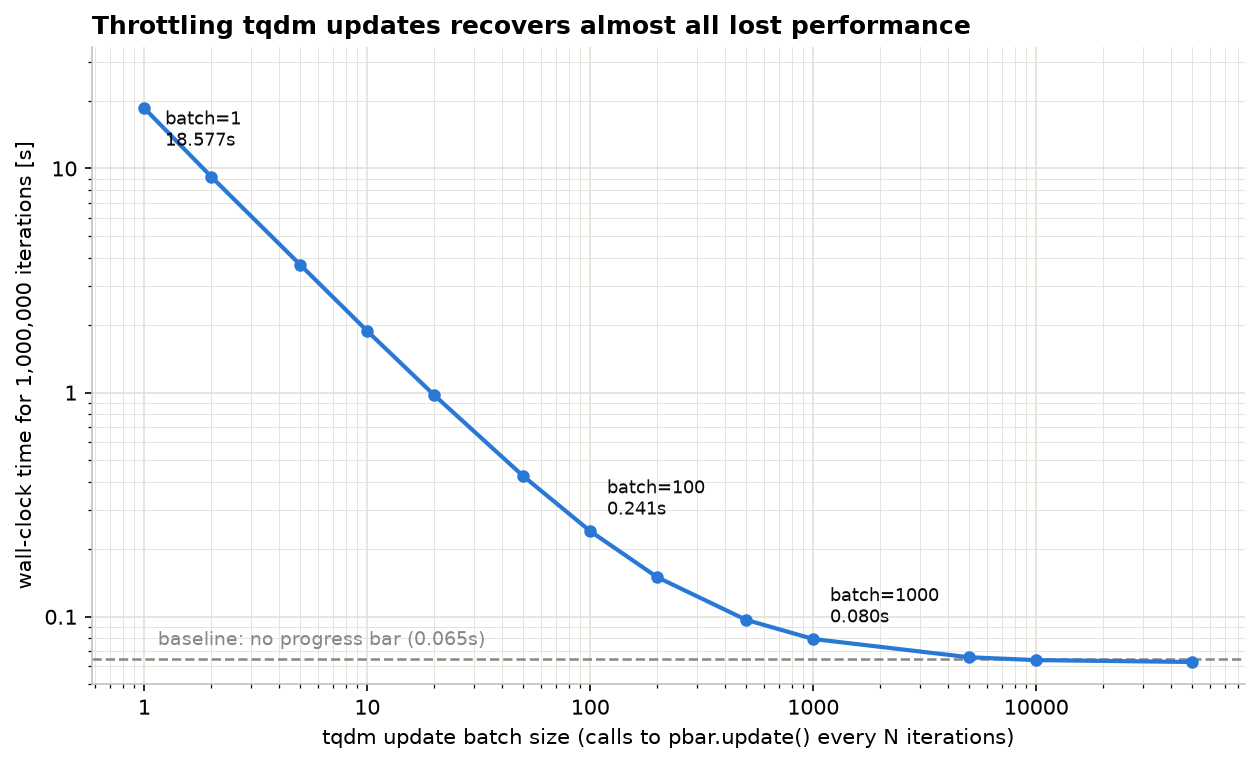
At batch=1 (updating every iteration) the loop took 18.6 seconds. At batch=100 (still redrawing 10,000 times) it dropped to 0.24 seconds, at batch=1000 to 0.08 seconds, and from batch=5000 onward it becomes indistinguishable from baseline (0.065s). In practice, the default (mininterval=0.1) is usually good enough, but if you want both visual smoothness and speed, set miniters explicitly to something like total // 100, or relax mininterval to 0.1-0.5 seconds.
Edge Case 1: Progress Bars Across Multiple Processes
If you spawn several worker processes that each run their own tqdm instance without using a helper like tqdm.contrib.concurrent.process_map, naive usage breaks the display. The cause is simple: without an explicit position, every bar defaults to position=0 – the same terminal row – and they all fight over it.
import multiprocessing as mp
import time
from tqdm import tqdm

def worker_naive(worker_id, n=40):
    # BUG: every worker stays at the default position=0 -> they all
    # contend for the same row.
    for i in tqdm(range(n), desc=f"worker-{worker_id}", position=0, mininterval=0, miniters=1):
        time.sleep(0.005)

if __name__ == "__main__":
    procs = [mp.Process(target=worker_naive, args=(i,)) for i in range(4)]
    for p in procs:
        p.start()
    for p in procs:
        p.join()
Inspecting the raw bytes actually written shows all four workers racing to return to the start of the same line via \r (measured, excerpt):
\rworker-0: 0%| | 0/40 [00:00<?, ?it/s]\rworker-2: 0%| | 0/40 [00:00<?, ?it/s]\rworker-1: 0%| | 0/40 [00:00<?, ?it/s]\rworker-3: 0%| | 0/40 [00:00<?, ?it/s]\rworker-0: 2%|...
Every write starts with \r and there is no cursor movement (no \033[nA-style row targeting) at all, so on a real terminal all four bars keep stomping over each other on the same row – the visible result is a broken display where only whichever process wrote most recently briefly shows through.
The standard fix is to assign each worker a distinct position and share a lock via tqdm.set_lock():
import multiprocessing as mp
import time
from tqdm import tqdm

def worker_fixed(worker_id, lock, n=40):
    # FIX: position=worker_id reserves a dedicated row, and the lock
    # (propagated from the parent process) is shared across workers.
    tqdm.set_lock(lock)
    for i in tqdm(
        range(n), desc=f"worker-{worker_id}", position=worker_id,
        mininterval=0, miniters=1,
    ):
        time.sleep(0.005)

if __name__ == "__main__":
    lock = mp.RLock()
    procs = [mp.Process(target=worker_fixed, args=(i, lock)) for i in range(4)]
    for p in procs:
        p.start()
    for p in procs:
        p.join()
The raw bytes after the fix show \x1b[A (cursor up one line) escape sequences and \n characters inserted around each update, moving to the worker’s own row before writing (excerpt):
\rworker-0: 0%| | 0/40 [00:00<?, ?it/s]\n\rworker-1: 0%| | 0/40 [00:00<?, ?it/s]\x1b[A\n\n\n\rworker-3: ...
tqdm.contrib.concurrent.process_map (covered earlier in this article) manages this position bookkeeping for you internally, so prefer it over manual position assignment whenever your parallel workload fits its shape. Reach for the “position + set_lock” pattern above only when you must manage a Pool/Process setup by hand.
Edge Case 2: Piping to a Non-TTY (Redirection, CI Logs)
When stdout is redirected to a file (python script.py > out.log) or run non-interactively as in a CI job log, the three libraries behave very differently by default. We ran a 30-iteration loop with output redirected to a plain file (instead of a terminal) and inspected the bytes written.
| Library | Default behavior | Bytes written | \r count |
|---|---|---|---|
tqdm (no options) | Keeps writing \r-based updates regardless (spams) | 285 bytes | 5 |
rich.progress (no options) | Detects non-terminal, prints only the final state once | 140 bytes | 0 |
alive-progress (no options) | Detects non-tty, disables all animation, final receipt only | 155 bytes | 0 |
Unless you explicitly pass disable, tqdm diligently keeps sending \r-based updates regardless of whether the output is a terminal. If you later cat that file, you get an unreadable line where many progress states are concatenated via \r. rich.progress and alive-progress, on the other hand, auto-detect that the destination isn’t a terminal (via internal Console.is_terminal / force_tty checks) and default to the conservative choice of skipping intermediate frames and printing only the final state.
To detect and control this explicitly:
import sys
from tqdm import tqdm

# tqdm does not auto-detect this, so check isatty() yourself and disable explicitly
is_interactive = sys.stdout.isatty()

for x in tqdm(range(1000), disable=not is_interactive, mininterval=0.5):
    ...

# or pass disable=None to auto-disable whenever output is redirected
for x in tqdm(range(1000), disable=None):
    ...
Passing disable=None makes tqdm check file.isatty() and automatically suppress the bar when it isn’t a terminal (note that disable’s actual default is False, so with no argument the bar always shows). If you want to keep CI logs clean, use disable=None or check sys.stdout.isatty() yourself. rich/alive-progress make this decision for you by default, but if you specifically want animation even when redirected, you can force it with force_terminal=True (rich) or force_tty=True (alive-progress).
Recent Developments (2024-2025)
tqdm: In 2024, a vulnerability was reported (CVE-2024-34062) where the CLI’s type conversion for optional arguments relied oneval(), allowing code execution via crafted non-boolean CLI arguments (e.g.--delim). It was fixed in v4.66.3, which replaced theeval()-based conversion with explicit, safe type handling. If you invoketqdmas a CLI tool (viapython -m tqdm), make sure you’re on 4.66.3 or later; ordinary library usage (from tqdm import tqdm) is unaffected.alive-progress: Development remains active, with v3.1.5 released in October 2024 and v3.2.0 in July 2025.tqdm.rich(the bundled rich-integration submodule shipped withtqdm) remains experimental and has not fully kept up with changes to rich’s own API. If you want to combine the two, usingrich.progressdirectly – as this article does – is more stable than going throughtqdm.rich.
The core APIs of all three libraries (tqdm(iterable), Progress(), alive_bar(total)) remain stable, so the code in this article should keep working going forward. Just double-check the version if you’re invoking tqdm as a standalone CLI tool.
Related Articles
- Bayesian Optimization: Theory and Python Implementation
- Surface the acquisition value live with a custom
bar_formatto debug surrogate fits. - Genetic Algorithms: Theory and Python Implementation - A nested tqdm bar over generations makes convergence behavior obvious at a glance.
- Simulated Annealing: Theory and Python Implementation
-
set_postfixis ideal for streaming the current temperature and acceptance rate. - Monte Carlo / Cross-Entropy Method
-
tqdm.contrib.concurrent.process_mapslots straight into parallel sampling loops. - Python Decorators: Mechanics and Practical Patterns - Decorator patterns applicable to progress bar implementations.
- Introduction to Asynchronous Programming with Python asyncio - Combining progress bars with async processing.
- Python Regular Expressions: Practical Guide - Practical Python tips.
- Matplotlib Practical Tips: Creating Publication-Quality Figures - Tips for visualizing data processing results.
- Gaussian Process Regression
- Long log-marginal-likelihood optimization and EI/UCB acquisition loops pair well with
tqdm.set_postfixto stream the current objective value. - Support Vector Machines (SVM)
- When running
GridSearchCVover C / gamma, atqdmbar over folds makes total wall-clock predictable.