Introduction
Are you still using print() for debugging and production monitoring in Python? While print is simple, it lacks log level control, file output, timestamps, and the ability to silence logs in production.
Python’s built-in logging module handles all of this declaratively. This article covers everything from basics to production-ready patterns.
Log Levels
logging provides five severity levels:
| Level | Value | Use Case |
|---|---|---|
DEBUG | 10 | Detailed diagnostic information (dev only) |
INFO | 20 | Confirmation that things are working normally |
WARNING | 30 | Something unexpected but processing continues |
ERROR | 40 | A serious problem; operation failed |
CRITICAL | 50 | A fatal error; the program may not continue |
The root logger outputs WARNING and above by default.
Logger Hierarchy and Propagation
Loggers created with logging.getLogger(name) form a tree based on the dots in name. For example, a logger named myapp.db.pool is a child of myapp.db, which is a child of myapp, which is a child of the root logger (the one returned by logging.getLogger() with no arguments).
import logging

app_logger = logging.getLogger("myapp")
db_logger = logging.getLogger("myapp.db")
pool_logger = logging.getLogger("myapp.db.pool")

print(app_logger.parent.name)   # root
print(db_logger.parent.name)    # myapp
print(pool_logger.parent.name)  # myapp.db
Every logger has a propagate attribute, True by default. When True, a log record is passed up to the parent logger’s handlers after being processed by the logger’s own handlers, and then to the grandparent, all the way to the root. This is why logging through myapp.db.pool can still produce output even if that specific logger has no handlers of its own – a handler attached to myapp or to root can end up doing the actual output.
Don’t confuse “logger level” with “handler level”
The single most common source of confusion when learning logging is that the logger’s level and each handler’s level are two separate gates, and a record must pass both to actually be emitted:
- First, the record is filtered against the logger’s own effective level (
getEffectiveLevel(), which walks up the tree if the logger itself isNOTSET). - Then, each handler that receives the record filters it again against that handler’s own
level.
Most “I set the logger to DEBUG but DEBUG messages still don’t show up” questions turn out to be a handler still sitting at WARNING or INFO. Let’s confirm this concretely:
import logging

demo_logger = logging.getLogger("demo.gate")
demo_logger.setLevel(logging.DEBUG)   # logger gate: DEBUG and above pass
demo_logger.propagate = False

handler = logging.StreamHandler()
handler.setLevel(logging.WARNING)     # handler gate: only WARNING and above pass
handler.setFormatter(logging.Formatter("[%(levelname)s] %(name)s: %(message)s"))
demo_logger.addHandler(handler)

demo_logger.debug("debug message (dropped by handler)")
demo_logger.info("info message (dropped by handler)")
demo_logger.warning("warning message (passes both gates)")
demo_logger.error("error message (passes both gates)")
demo_logger.critical("critical message (passes both gates)")
Actual output:
[WARNING] demo.gate: warning message (passes both gates)
[ERROR] demo.gate: error message (passes both gates)
[CRITICAL] demo.gate: critical message (passes both gates)
debug() and info() pass the logger-level gate (DEBUG) but are silently dropped at the handler-level gate (WARNING), and never reach the console. If lowering the logger’s level doesn’t make new messages appear, check the handler’s level too.
Basic Usage
Configuration with basicConfig
import logging

logging.basicConfig(
    level=logging.DEBUG,
    format="%(asctime)s %(levelname)s %(message)s",
    datefmt="%Y-%m-%d %H:%M:%S",
)

logging.debug("Debug info")
logging.info("Normal operation")
logging.warning("Warning")
logging.error("Error occurred")
logging.critical("Critical failure")
Sample output:
2026-03-12 10:00:00 DEBUG Debug info
2026-03-12 10:00:00 INFO Normal operation
2026-03-12 10:00:00 WARNING Warning
2026-03-12 10:00:00 ERROR Error occurred
2026-03-12 10:00:00 CRITICAL Critical failure
Per-Module Loggers
In production code, use logging.getLogger(__name__) to create a module-specific logger. This makes it easy to identify the source of each log message.
import logging

logger = logging.getLogger(__name__)

def process_data(data):
    logger.info("Processing started: %d items", len(data))
    try:
        result = [x * 2 for x in data]
        logger.debug("Result: %s", result)
        return result
    except Exception as e:
        logger.error("Processing failed: %s", e, exc_info=True)
        raise
exc_info=True automatically appends the stack trace to the log entry.
Customizing Formats
Use %(...)s-style format strings to control how log entries look:
import logging

formatter = logging.Formatter(
    fmt="%(asctime)s [%(levelname)-8s] %(name)s:%(lineno)d - %(message)s",
    datefmt="%Y-%m-%dT%H:%M:%S",
)

handler = logging.StreamHandler()
handler.setFormatter(formatter)

logger = logging.getLogger("myapp")
logger.setLevel(logging.DEBUG)
logger.addHandler(handler)

logger.info("Service started")
Sample output:
2026-03-12T10:00:00 [INFO ] myapp:10 - Service started
Key format variables:
| Variable | Content |
|---|---|
%(asctime)s | Timestamp |
%(levelname)s | Log level name |
%(name)s | Logger name |
%(filename)s | Source filename |
%(lineno)d | Line number |
%(funcName)s | Function name |
%(message)s | Log message |
%(process)d | Process ID |
%(thread)d | Thread ID |
Handler Types
Handlers determine where logs are sent. You can attach multiple handlers to a single logger.
StreamHandler (stdout/stderr)
import logging
import sys

console_handler = logging.StreamHandler(sys.stdout)
console_handler.setLevel(logging.INFO)
FileHandler (file output)
file_handler = logging.FileHandler("app.log", encoding="utf-8")
file_handler.setLevel(logging.DEBUG)
RotatingFileHandler (size-based rotation)
In production, prevent log files from growing indefinitely using automatic rotation:
from logging.handlers import RotatingFileHandler

rotating_handler = RotatingFileHandler(
    "app.log",
    maxBytes=10 * 1024 * 1024,  # 10 MB
    backupCount=5,               # Keep up to 5 backup files
    encoding="utf-8",
)
When app.log reaches 10 MB, it is renamed to app.log.1, and a new app.log is created.
Let’s actually force a rotation by using a tiny maxBytes and confirm the backup files are created:
from logging.handlers import RotatingFileHandler
import logging

logger = logging.getLogger("demo.size_rotate")
logger.setLevel(logging.DEBUG)
logger.propagate = False

handler = RotatingFileHandler(
    "size.log",
    maxBytes=200,      # deliberately tiny to force rotation quickly
    backupCount=3,
    encoding="utf-8",
)
handler.setFormatter(logging.Formatter("%(asctime)s %(levelname)s %(message)s"))
logger.addHandler(handler)

for i in range(40):
    logger.info("size-rotation test line %03d - padding text to fill bytes", i)
Listing the directory afterward confirms exactly backupCount=3 backup generations were created:
$ ls -la
size.log       186 bytes
size.log.1     186 bytes
size.log.2     186 bytes
size.log.3     186 bytes
Each time size.log exceeds maxBytes, the generations slide: size.log → size.log.1 → size.log.2 → …, and once a generation exceeds backupCount, the oldest one is deleted.
TimedRotatingFileHandler (time-based rotation)
For daily rotation:
from logging.handlers import TimedRotatingFileHandler

timed_handler = TimedRotatingFileHandler(
    "app.log",
    when="midnight",   # Rotate at midnight each day
    interval=1,
    backupCount=30,    # Keep 30 days of logs
    encoding="utf-8",
)
when="midnight" rotates daily, which would take a day to verify – but the same logic can be verified in seconds using when="S", interval=1 (rotate every second):
from logging.handlers import TimedRotatingFileHandler
import logging
import time

logger = logging.getLogger("demo.timed_rotate")
logger.setLevel(logging.DEBUG)
logger.propagate = False

handler = TimedRotatingFileHandler(
    "timed.log",
    when="S",
    interval=1,        # deliberately 1 second to force rotation quickly
    backupCount=5,
    encoding="utf-8",
)
handler.setFormatter(logging.Formatter("%(asctime)s %(levelname)s %(message)s"))
logger.addHandler(handler)

for i in range(4):
    logger.info("timed-rotation test line, batch %d", i)
    time.sleep(1.1)  # cross the 1-second rotation boundary each time
Actual output:
$ ls -la
timed.log                          63 bytes
timed.log.2026-07-19_09-49-53      63 bytes
timed.log.2026-07-19_09-49-54      63 bytes
timed.log.2026-07-19_09-49-55      63 bytes
The practical difference: RotatingFileHandler rotates using numeric suffixes (.1, .2, …), while TimedRotatingFileHandler rotates using timestamp suffixes (e.g. .2026-07-19_09-49-53). The numeric scheme always keeps “the last N generations”; the timestamp scheme makes it obvious from the filename exactly when each log segment was written.
Production Setup Pattern
For multi-module applications, use a dedicated setup function:
import logging
import sys
from logging.handlers import RotatingFileHandler


def setup_logging(log_level: str = "INFO", log_file: str = "app.log") -> None:
    """Initialize application-wide logging."""
    level = getattr(logging, log_level.upper(), logging.INFO)

    formatter = logging.Formatter(
        fmt="%(asctime)s [%(levelname)-8s] %(name)s - %(message)s",
        datefmt="%Y-%m-%dT%H:%M:%S",
    )

    # Console: INFO and above
    console_handler = logging.StreamHandler(sys.stdout)
    console_handler.setLevel(logging.INFO)
    console_handler.setFormatter(formatter)

    # File: DEBUG and above (with rotation)
    file_handler = RotatingFileHandler(
        log_file,
        maxBytes=10 * 1024 * 1024,
        backupCount=5,
        encoding="utf-8",
    )
    file_handler.setLevel(logging.DEBUG)
    file_handler.setFormatter(formatter)

    root_logger = logging.getLogger()
    root_logger.setLevel(level)
    root_logger.addHandler(console_handler)
    root_logger.addHandler(file_handler)


if __name__ == "__main__":
    setup_logging(log_level="DEBUG")

    logger = logging.getLogger(__name__)
    logger.info("Application started")
    logger.debug("Debug info (file only)")
Logging Exceptions
Use logger.exception() inside an except block to log both the message and full stack trace in one call:
import logging

logger = logging.getLogger(__name__)


def divide(a, b):
    try:
        return a / b
    except ZeroDivisionError:
        logger.exception("Division by zero: a=%s, b=%s", a, b)
        return None


divide(10, 0)
Sample output:
2026-03-12T10:00:00 [ERROR   ] __main__ - Division by zero: a=10, b=0
Traceback (most recent call last):
  File "example.py", line 7, in divide
    return a / b
ZeroDivisionError: division by zero
Dictionary-based Configuration (dictConfig)
For large applications, manage logging configuration as a dictionary (or YAML/JSON):
import logging
import logging.config

LOGGING_CONFIG = {
    "version": 1,
    "disable_existing_loggers": False,
    "formatters": {
        "standard": {
            "format": "%(asctime)s [%(levelname)s] %(name)s: %(message)s",
        },
        "detailed": {
            "format": "%(asctime)s [%(levelname)-8s] %(name)s:%(lineno)d %(funcName)s() - %(message)s",
        },
    },
    "handlers": {
        "console": {
            "class": "logging.StreamHandler",
            "level": "INFO",
            "formatter": "standard",
            "stream": "ext://sys.stdout",
        },
        "file": {
            "class": "logging.handlers.RotatingFileHandler",
            "level": "DEBUG",
            "formatter": "detailed",
            "filename": "app.log",
            "maxBytes": 10485760,
            "backupCount": 5,
            "encoding": "utf-8",
        },
    },
    "loggers": {
        "myapp": {
            "handlers": ["console", "file"],
            "level": "DEBUG",
            "propagate": False,
        },
    },
    "root": {
        "handlers": ["console"],
        "level": "WARNING",
    },
}

logging.config.dictConfig(LOGGING_CONFIG)
logger = logging.getLogger("myapp")
logger.info("Logger configured via dictConfig")
Structured Logging with structlog
JSON logs integrate easily with log aggregation platforms (Datadog, CloudWatch, ELK). The structlog library makes structured logging straightforward:
# pip install structlog
import structlog

structlog.configure(
    processors=[
        structlog.processors.TimeStamper(fmt="iso"),
        structlog.stdlib.add_log_level,
        structlog.processors.JSONRenderer(),
    ],
)

log = structlog.get_logger()
log.info("User logged in", user_id=42, ip="192.168.1.1")
Sample output (JSON):
{
  "timestamp": "2026-03-12T10:00:00Z",
  "level": "info",
  "event": "User logged in",
  "user_id": 42,
  "ip": "192.168.1.1"
}
Without structlog, you can achieve JSON logging with a custom formatter:
import json
import logging


class JsonFormatter(logging.Formatter):
    def format(self, record):
        log_data = {
            "timestamp": self.formatTime(record, "%Y-%m-%dT%H:%M:%S"),
            "level": record.levelname,
            "logger": record.name,
            "message": record.getMessage(),
        }
        if record.exc_info:
            log_data["exception"] = self.formatException(record.exc_info)
        return json.dumps(log_data, ensure_ascii=False)


handler = logging.StreamHandler()
handler.setFormatter(JsonFormatter())
logger = logging.getLogger("myapp")
logger.addHandler(handler)
logger.info("JSON formatted log entry")
Edge Cases You Will Actually Hit in Production
Pitfall 1: the classic “basicConfig() silently does nothing” trap
logging.basicConfig() has a subtle but important rule that catches a lot of people off guard: if the root logger already has even one handler attached, basicConfig() is a no-op (unless you pass force=True). This is documented behavior, but it bites in scenarios like:
- A library you depend on (a cloud SDK, Jupyter, some web frameworks) attaches a handler to the root logger as an import-time side effect
- Some other module already called
logging.basicConfig()orlogging.warning(...)before your code ran (module-level functions likelogging.warning()implicitly callbasicConfig()once internally)
In that state, your own logging.basicConfig(level=logging.DEBUG, format=...) call has zero effect – neither the level nor the format changes. Let’s confirm this concretely:
import logging


def third_party_library_import_side_effect():
    """Simulates a library that adds its own handler to the root logger
    as an import-time side effect."""
    root = logging.getLogger()
    h = logging.StreamHandler()
    h.setFormatter(logging.Formatter("[3rd-party handler] %(levelname)s %(message)s"))
    root.addHandler(h)


# Step 1: a third-party import adds a handler to the root logger
third_party_library_import_side_effect()
print("handlers:", logging.getLogger().handlers)

# Step 2: our app calls basicConfig(), expecting to set DEBUG level
logging.basicConfig(
    level=logging.DEBUG,
    format="%(asctime)s %(levelname)s %(message)s",
    force=False,  # the default
)
print("level:", logging.getLevelName(logging.getLogger().level))

logging.debug("this should show as DEBUG per our basicConfig call")
logging.info("this should show as INFO per our basicConfig call")
Actual output (the debug()/info() calls print nothing at all):
handlers: [<StreamHandler <stderr> (NOTSET)>]
level: WARNING
The root logger’s level is still WARNING, and the debug()/info() calls are silently swallowed. basicConfig() itself never raises an error, which is exactly what makes this so easy to miss.
The fix: pass force=True, which closes and removes all existing handlers before applying the new configuration.
logging.basicConfig(
    level=logging.DEBUG,
    format="%(asctime)s %(levelname)s %(message)s",
    force=True,
)
logging.debug("this should show as DEBUG per our basicConfig call")
logging.info("this should show as INFO per our basicConfig call")
2026-07-19 09:49:39,456 DEBUG this should show as DEBUG per our basicConfig call
2026-07-19 09:49:39,456 INFO this should show as INFO per our basicConfig call
With force=True, the log lines now appear with the expected level and format.
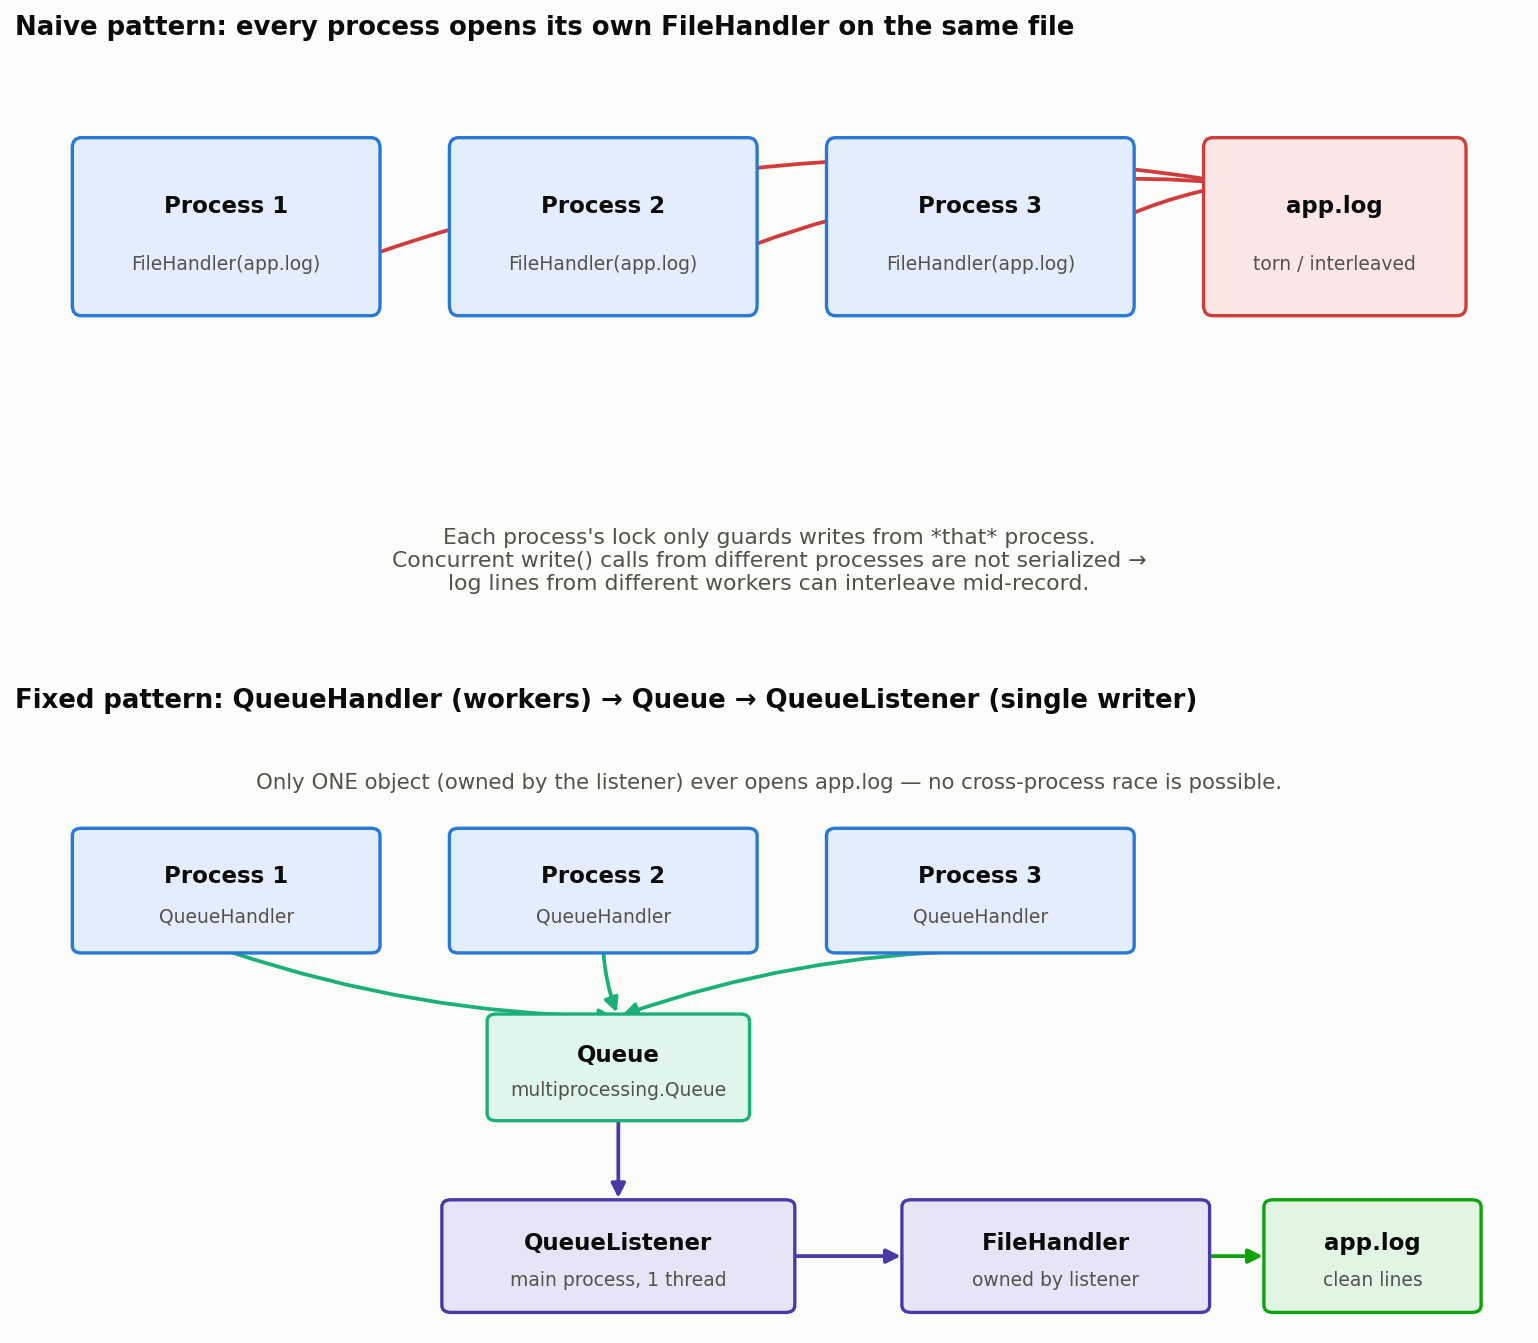
Pitfall 2: log corruption from multiple processes/threads, and the QueueHandler/QueueListener fix
Having multiple processes (or threads) each open their own FileHandler on the same log file is a classic anti-pattern. The Python Logging Cookbook says this explicitly:
logging to a single file from multiple processes is not supported, because there is no standard way to serialize access to a single file across multiple processes in Python.
Each process’s FileHandler owns its own lock (a threading.Lock), which only provides mutual exclusion within that single process. It provides zero coordination against writes from other processes, so when multiple processes write concurrently, log lines can end up interleaved (torn) mid-record, depending on timing.
In the demo below, each record is deliberately written as two separate write() calls – a header and a body – which mirrors what actually happens once a message exceeds the stream’s internal buffer, or when a formatter writes a header and payload separately. This makes the race condition reliably observable:
import multiprocessing

LOG_PATH = "naive_multiproc.log"
N_WORKERS = 6
N_LINES_PER_WORKER = 60


def worker(worker_id: int):
    tag = chr(ord("A") + worker_id)
    # Each process independently opens the same file path -- the same
    # mistake as each process creating its own FileHandler(LOG_PATH).
    f = open(LOG_PATH, "a", encoding="utf-8")
    for i in range(N_LINES_PER_WORKER):
        f.write(f"[{tag}#{i:03d}] ")   # write call 1
        f.flush()
        f.write(tag * 40 + "\n")       # write call 2 -- race window
        f.flush()
    f.close()


if __name__ == "__main__":
    procs = [multiprocessing.Process(target=worker, args=(i,)) for i in range(N_WORKERS)]
    for p in procs:
        p.start()
    for p in procs:
        p.join()
Actual output (360 records expected; corrupted lines are detected by pattern-matching):
expected records            : 360
physical lines in file      : 360
well-formed lines           : 278
corrupted/interleaved lines : 82

--- first 6 corrupted lines (raw bytes, showing mixed worker tags) ---
'[D#000] [F#018] DDDDDDDDDDDDDDDDDDDDDDDDDDDDDDDDDDDDDDDD\n'
'FFFFFFFFFFFFFFFFFFFFFFFFFFFFFFFFFFFFFFFF\n'
'[D#001] [F#020] DDDDDDDDDDDDDDDDDDDDDDDDDDDDDDDDDDDDDDDD\n'
'FFFFFFFFFFFFFFFFFFFFFFFFFFFFFFFFFFFFFFFF\n'
'[D#002] [F#021] DDDDDDDDDDDDDDDDDDDDDDDDDDDDDDDDDDDDDDDD\n'
'FFFFFFFFFFFFFFFFFFFFFFFFFFFFFFFFFFFFFFFF\n'
Out of 360 expected records, 82 got interleaved with another process’s write in the middle (notice [D#000] immediately followed by [F#018] where D’s own body should have continued). Note that how much corruption you observe is timing- and OS-dependent – with short single-write() messages, some environments happen not to show any corruption on a given run, which is exactly why this bug is so dangerous: it “works fine” in development and then shows up under production load or with different message sizes.
The correct fix is to never let worker processes (or threads) touch the file directly. Instead, each worker sends its log records to a queue via QueueHandler, and a single QueueListener owns the actual file writing. Because only one object ever opens the file, the race is structurally impossible:
import logging
import logging.handlers
import multiprocessing

LOG_PATH = "queue_fixed.log"
N_WORKERS = 6
N_LINES_PER_WORKER = 60


def worker(worker_id: int, queue: multiprocessing.Queue):
    # Each worker only ever talks to the queue -- never the file.
    qh = logging.handlers.QueueHandler(queue)
    logger = logging.getLogger(f"worker{worker_id}")
    logger.setLevel(logging.INFO)
    logger.addHandler(qh)
    logger.propagate = False

    tag = chr(ord("A") + worker_id)
    for i in range(N_LINES_PER_WORKER):
        logger.info("[%s#%03d] %s", tag, i, tag * 40)


if __name__ == "__main__":
    log_queue: multiprocessing.Queue = multiprocessing.Queue(-1)

    # The only thing that ever opens the file, owned by the listener.
    file_handler = logging.FileHandler(LOG_PATH, mode="a", encoding="utf-8")
    file_handler.setFormatter(logging.Formatter("%(message)s"))

    listener = logging.handlers.QueueListener(log_queue, file_handler)
    listener.start()

    procs = [
        multiprocessing.Process(target=worker, args=(i, log_queue))
        for i in range(N_WORKERS)
    ]
    for p in procs:
        p.start()
    for p in procs:
        p.join()

    listener.stop()  # flushes remaining records and joins the listener thread
Actual output:
expected records            : 360
physical lines in file      : 360
well-formed lines           : 360
corrupted/interleaved lines : 0
Same workload, same concurrency – zero corrupted lines. The QueueHandler/QueueListener pattern works the same way for multithreaded code (threading + queue.Queue, no multiprocessing needed), and has the added benefit of moving expensive I/O handlers (e.g. shipping logs over the network) off the hot path and onto a dedicated listener.
What’s New in logging Since Python 3.11
Most of this article applies to any Python 3 version, but recent releases have quietly added a few genuinely useful things to logging:
| Version | Addition | What it does |
|---|---|---|
| 3.11 | logging.getLevelNamesMapping() | An official API for getting a mapping of level name → numeric value. Previously you had to reach into the private logging._nameToLevel |
| 3.12 | logging.getHandlerByName() / logging.getHandlerNames() | Look up or enumerate named handlers by name – handy for retrieving a handler configured via dictConfig later |
| 3.12 | dictConfig() support for QueueHandler/QueueListener | dictConfig’s handlers section now accepts queue and listener keys, letting you declare the exact QueueHandler/QueueListener wiring from Pitfall 2 above in a config dict (you still have to call .listener.start() yourself) |
| 3.13 | merge_extra parameter on LoggerAdapter | Controls whether the extra passed to an individual log call is merged with the LoggerAdapter’s own extra (default: not merged) |
The 3.12 declarative QueueHandler/QueueListener support in particular has real practical impact – it lets you express the wiring we hand-built above directly in a configuration dict instead of imperative setup code.
print vs logging
| Aspect | print | logging |
|---|---|---|
| Level control | Not available | 5 levels |
| File output | Shell redirection only | FileHandler |
| Timestamps | Manual | Automatic via formatter |
| Stack traces | Manual with traceback | exc_info=True |
| Silence in production | Delete or conditionals | Set level to WARNING+ |
| Log rotation | Not available | RotatingFileHandler |
| Structured logging | Not available | dictConfig + structlog |
Related Articles
- Python Decorator Patterns
- Combining
@timerand@retrydecorators with logging - Python asyncio Introduction - Logging considerations in async code
- Building a Progress Bar in Python - When to use logging vs progress indicators in CLI tools
- How to Overwrite Print Output in Python - When print is still the right tool