Introduction
DTFT, DFT, FFT — the abbreviations look almost identical, and it is easy to use them loosely without internalizing what each one really means. In fact the three are sharply distinct:
- DTFT (Discrete-Time Fourier Transform) — a continuous frequency representation of a discrete-time signal
- DFT (Discrete Fourier Transform) — the DTFT sampled on the frequency axis
- FFT (Fast Fourier Transform) — an algorithm that computes the DFT efficiently
This article walks through the chain from continuous-time signals to sampled signals and then to spectra, organizes the definitions and relationships of DTFT/DFT/FFT, and finally compares a direct DFT computation with np.fft.fft in Python to confirm understanding.
The companion articles FFT: Theory and Python Implementation and Window Functions and PSD focus on implementations; this article complements them by laying out the underlying theory.
From Continuous to Discrete Signals
Continuous-Time Fourier Transform (CTFT)
The Fourier transform of a continuous-time signal \(x_c(t)\) is defined as
\[X_c(j\Omega) = \int_{-\infty}^{\infty} x_c(t)\, e^{-j\Omega t}\, dt \tag{1}\]where \(\Omega\) is the continuous angular frequency in rad/s. \(X_c(j\Omega)\) is a continuous function of frequency.
Discretization via Sampling
As covered in the sampling theorem article , sampling \(x_c(t)\) with period \(T_s\) (rate \(f_s = 1/T_s\) ) yields the discrete-time signal \(x[n] = x_c(nT_s)\) . The discrete-domain angular frequency \(\omega\) relates to the continuous one \(\Omega\) by
\[\omega = \Omega T_s \tag{2}\]\(\omega\) has units of rad/sample and is \(2\pi\) -periodic. This is the natural axis on which DTFT and DFT are defined.
DTFT: Discrete-Time Fourier Transform
Definition
For a discrete-time signal \(x[n]\) (\(n \in \mathbb{Z}\) ), the DTFT is
\[X(e^{j\omega}) = \sum_{n=-\infty}^{\infty} x[n]\, e^{-j\omega n} \tag{3}\]where \(\omega \in \mathbb{R}\) is a continuous angular frequency in rad/sample, and \(X(e^{j\omega})\) is a \(2\pi\) -periodic continuous function of \(\omega\) .
Inverse DTFT
\[x[n] = \frac{1}{2\pi}\int_{-\pi}^{\pi} X(e^{j\omega})\, e^{j\omega n}\, d\omega \tag{4}\]The integration window \([-\pi, \pi]\) covers a full period.
Key Properties
- Periodicity: \(X(e^{j(\omega + 2\pi)}) = X(e^{j\omega})\)
- Linearity: \(\mathcal{F}\{a x_1[n] + b x_2[n]\} = a X_1(e^{j\omega}) + b X_2(e^{j\omega})\)
- Time shift: \(\mathcal{F}\{x[n - k]\} = e^{-j\omega k} X(e^{j\omega})\)
- Convolution theorem: \(\mathcal{F}\{x_1[n] * x_2[n]\} = X_1(e^{j\omega})\, X_2(e^{j\omega})\)
- Parseval: \(\sum_{n} |x[n]|^2 = \dfrac{1}{2\pi}\int_{-\pi}^{\pi} |X(e^{j\omega})|^2 d\omega\)
Connection to the Z-Transform
As the Z-transform article shows, the DTFT is the Z-transform \(X(z) = \sum_n x[n] z^{-n}\) evaluated on the unit circle \(z = e^{j\omega}\) . The DTFT exists only when the ROC of the Z-transform contains the unit circle.
Why the DTFT Alone Is Not Enough on a Computer
Two practical issues prevent direct numerical use:
- Infinite sum — undefined for finite memory.
- Continuous frequency axis — \(\omega \in \mathbb{R}\) cannot be stored as-is.
The DFT addresses both.
DFT: Discrete Fourier Transform
Definition
For a finite-length signal \(x[n]\) (\(n = 0, 1, \ldots, N-1\) ), the DFT is
\[X[k] = \sum_{n=0}^{N-1} x[n]\, e^{-j 2\pi kn/N}, \quad k = 0, 1, \ldots, N-1 \tag{5}\]The DFT is a finite-to-finite map: \(N\) samples in, \(N\) samples out. This is the central distinction from the DTFT.
Inverse DFT (IDFT)
\[x[n] = \frac{1}{N}\sum_{k=0}^{N-1} X[k]\, e^{j 2\pi kn/N}, \quad n = 0, 1, \ldots, N-1 \tag{6}\]Relationship Between DTFT and DFT
The DFT samples the DTFT at \(N\) equally spaced frequencies \(\omega_k = 2\pi k / N\) (\(k = 0, \ldots, N-1\) ):
\[X[k] = X(e^{j\omega})\big|_{\omega = 2\pi k/N} = \sum_{n=0}^{N-1} x[n]\, e^{-j 2\pi kn/N} \tag{7}\]In other words, the DFT is the DTFT discretized on the frequency axis as well, producing a finite data structure that fits in memory. \(X[k]\) are samples of the continuous spectrum \(X(e^{j\omega})\) , and values between bins are not represented.
Frequency Resolution
For sampling rate \(f_s\) and DFT length \(N\) , bin \(k\) corresponds to physical frequency
\[f_k = \frac{k}{N} f_s \tag{8}\]with bin spacing \(\Delta f = f_s / N\) . The longer the observation window \(T = N/f_s\) , the finer the resolution.
Spectral Leakage
Equation \((5)\) implicitly assumes that \(x[n]\) is periodic with period \(N\) . When the actual signal does not match this implied period, finite-length truncation causes spectral leakage, mitigated by window functions .
FFT: Fast Fourier Transform
The FFT Is an Algorithm
A crucial point: the FFT is not a new transform, but a family of algorithms that compute the DFT efficiently. The output \(X[k]\) is exactly the DFT — only the procedure differs.
A naive evaluation of equation \((5)\) requires \(N\) complex multiplications per output bin, summing to \(O(N^2)\) operations overall. For \(N = 10^6\) that is \(10^{12}\) operations — far beyond real-time.
The Cooley-Tukey Idea
The 1965 Cooley-Tukey FFT splits a length-\(N\) DFT (with \(N\) composite, especially a power of two) into two length-\(N/2\) DFTs. With \(x_e[m] = x[2m]\) and \(x_o[m] = x[2m+1]\) ,
\[X[k] = \underbrace{\sum_{m=0}^{N/2-1} x_e[m]\, e^{-j 2\pi km/(N/2)}}_{E[k]} + W_N^k \underbrace{\sum_{m=0}^{N/2-1} x_o[m]\, e^{-j 2\pi km/(N/2)}}_{O[k]} \tag{9}\]where \(W_N = e^{-j 2\pi / N}\) . Using the symmetry \(W_N^{k + N/2} = -W_N^k\) ,
\[X[k] = E[k] + W_N^k\, O[k], \quad X[k + N/2] = E[k] - W_N^k\, O[k] \tag{10}\]— the butterfly operation. Recursive halving gives the recurrence \(T(N) = 2T(N/2) + O(N)\) , whose solution is
\[T(N) = O(N \log N) \tag{11}\]A full derivation is in the FFT article .
Complexity Comparison
| Size \(N\) | DFT \(O(N^2)\) | FFT \(O(N \log_2 N)\) | Speedup |
|---|---|---|---|
| \(2^{10}\) | \(\approx 10^6\) | \(\approx 10^4\) | \(\sim 100\times\) |
| \(2^{16}\) | \(\approx 4 \times 10^9\) | \(\approx 10^6\) | \(\sim 4000\times\) |
| \(2^{20}\) | \(\approx 10^{12}\) | \(\approx 2 \times 10^7\) | \(\sim 50000\times\) |
The advantage of the FFT grows quickly with \(N\) .
Beyond radix-2
Production FFT libraries combine several algorithms to handle non-power-of-two lengths efficiently:
- radix-2 / radix-4 / split-radix — the staple algorithms for power-of-two lengths
- mixed-radix — generalization to any composite \(N = N_1 N_2\)
- Bluestein / chirp-Z — chirp-convolution transform for arbitrary \(N\)
- Rader — cyclic-convolution transform for prime \(N\)
NumPy’s np.fft.fft (FFTPACK / pocketfft underneath) dispatches between these, so the FFT remains efficient even when \(N\)
is not a power of two.
Recent Research: FFT on GPU Tensor Cores
The Cooley-Tukey FFT was designed around serial computation on a CPU, but recent work has re-engineered it to exploit GPU Tensor Cores, which are specialized for matrix multiplication. In November 2023, Fu et al. at Stanford showed that FFT-based convolution over long sequences can be reformulated as a sequence of small matrix multiplications, making it possible to run on Tensor Cores and achieve up to a \(7.93\times\) speedup over a standard PyTorch implementation ( FlashFFTConv: Efficient Convolutions for Long Sequences with Tensor Cores , Fu et al., 2023; accepted at ICLR 2024).
This underscores a point closely related to the timing gap we just measured: it is not only the \(O(N \log N)\) operation count that matters, but how those operations map onto the underlying hardware. Just as fixed call overhead dominated our small-\(N\) timing measurements, at large scale memory I/O and compute-unit utilization can matter as much as — or more than — the theoretical complexity.
Putting DTFT, DFT, and FFT Together
| Transform | Input | Output | Frequency axis | Nature |
|---|---|---|---|---|
| DTFT | discrete, infinite | continuous \(X(e^{j\omega})\) | continuous, \(2\pi\) -periodic | mathematical definition |
| DFT | discrete, length \(N\) | discrete, \(N\) samples \(X[k]\) | sampled at \(\omega_k = 2\pi k/N\) | computable transform |
| FFT | discrete, length \(N\) | identical to DFT | identical to DFT | fast algorithm for the DFT |
Concisely:
- DTFT — the theoretical definition.
- DFT — DTFT sampled in frequency; the finite, computable version.
- FFT — an \(O(N \log N)\) algorithm for the DFT.
The output of an FFT is the DFT — distinguishing the algorithm from the transform is conceptually important.
Comparing Direct DFT and FFT in Python
Direct DFT from the Definition
In matrix form, the DFT is \(X = W x\) with the DFT matrix \(W_{kn} = e^{-j 2\pi kn / N}\) . NumPy broadcasting gives a one-line implementation.
import numpy as np

def dft_direct(x: np.ndarray) -> np.ndarray:
    """Compute the DFT directly in O(N^2)."""
    x = np.asarray(x, dtype=complex)
    N = x.shape[0]
    n = np.arange(N)
    k = n.reshape(-1, 1)                 # column vector
    W = np.exp(-2j * np.pi * k * n / N)  # DFT matrix (N x N)
    return W @ x

# --- Verify against np.fft.fft ---
rng = np.random.default_rng(0)
x = rng.standard_normal(256) + 1j * rng.standard_normal(256)

X_dft = dft_direct(x)
X_fft = np.fft.fft(x)

abs_err = np.max(np.abs(X_dft - X_fft))
print(f"max absolute error: {abs_err:.3e}")
# Example output: max absolute error: 3.813e-12
The discrepancy is at floating-point round-off level (\(\sim 10^{-12}\) ), confirming that the FFT computes the DFT exactly (to machine precision).
Timing the Two
Vary \(N\) to feel the gap between \(O(N^2)\) and \(O(N \log N)\) . Wall-clock time is noisy, so we take the median of 7 runs at each \(N\) .
import time
import numpy as np

def dft_direct(x):
    x = np.asarray(x, dtype=complex)
    N = x.shape[0]
    n = np.arange(N)
    k = n.reshape(-1, 1)
    W = np.exp(-2j * np.pi * k * n / N)
    return W @ x

sizes = [2**p for p in range(6, 13)]  # 64, 128, ..., 4096
t_dft, t_fft = [], []
rng = np.random.default_rng(1)

for N in sizes:
    x = rng.standard_normal(N) + 1j * rng.standard_normal(N)

    times_dft = []
    for _ in range(7):
        t0 = time.perf_counter()
        _ = dft_direct(x)
        times_dft.append(time.perf_counter() - t0)
    t_dft.append(np.median(times_dft))

    times_fft = []
    for _ in range(7):
        t0 = time.perf_counter()
        _ = np.fft.fft(x)
        times_fft.append(time.perf_counter() - t0)
    t_fft.append(np.median(times_fft))

for N, td, tf in zip(sizes, t_dft, t_fft):
    print(f"N={N:5d}  DFT={td:.3e}s  FFT={tf:.3e}s  speedup={td / tf:8.1f}x")

# Least-squares slope (power exponent) on the log-log data
slope_dft = np.polyfit(np.log(sizes), np.log(t_dft), 1)[0]
slope_fft = np.polyfit(np.log(sizes), np.log(t_fft), 1)[0]
print(f"log-log slope  DFT: {slope_dft:.2f}   FFT: {slope_fft:.2f}")
Output (measured on Python 3.13 / NumPy 2.4.2, Apple Silicon):
N=   64  DFT=9.104e-05s  FFT=4.917e-06s  speedup=    18.5x
N=  128  DFT=2.760e-04s  FFT=4.334e-06s  speedup=    63.7x
N=  256  DFT=1.061e-03s  FFT=6.459e-06s  speedup=   164.3x
N=  512  DFT=4.023e-03s  FFT=6.542e-06s  speedup=   615.0x
N= 1024  DFT=1.703e-02s  FFT=1.067e-05s  speedup=  1597.0x
N= 2048  DFT=7.050e-02s  FFT=1.633e-05s  speedup=  4316.2x
N= 4096  DFT=2.759e-01s  FFT=2.938e-05s  speedup=  9393.9x
log-log slope  DFT: 1.95   FFT: 0.44
The DFT slope, 1.95, is close to the theoretical 2 (\(O(N^2)\) ). The FFT slope, however, is only 0.44 — far from the “nearly 1” one would expect from \(O(N \log N)\) . This is a real-world pitfall: theoretical complexity and measured wall-clock time can diverge. Over this range of \(N\) (64 to 4096), the FFT’s own arithmetic (microseconds) is dwarfed by the fixed overhead of the Python function call and NumPy’s dispatch machinery (also a few microseconds), which pulls the measured slope away from the theoretical value. Observing the true asymptotic behavior requires pushing \(N\) much larger (beyond \(10^5\) ) or subtracting out the overhead. When benchmarking FFT performance in practice, ignoring this fixed cost can lead to the wrong conclusion about whether the FFT is “fast” or “slow.”
Plotting the measured data:
import matplotlib.pyplot as plt

plt.figure(figsize=(8, 5))
plt.loglog(sizes, t_dft, "o-", label="DFT direct  (O(N^2))")
plt.loglog(sizes, t_fft, "s-", label="np.fft.fft  (O(N log N))")
plt.xlabel("N (signal length)")
plt.ylabel("Elapsed time [s]")
plt.title("DFT vs FFT: computational cost")
plt.grid(True, which="both", alpha=0.3)
plt.legend()
plt.tight_layout()
plt.savefig("dft_fft_timing.png", dpi=150)
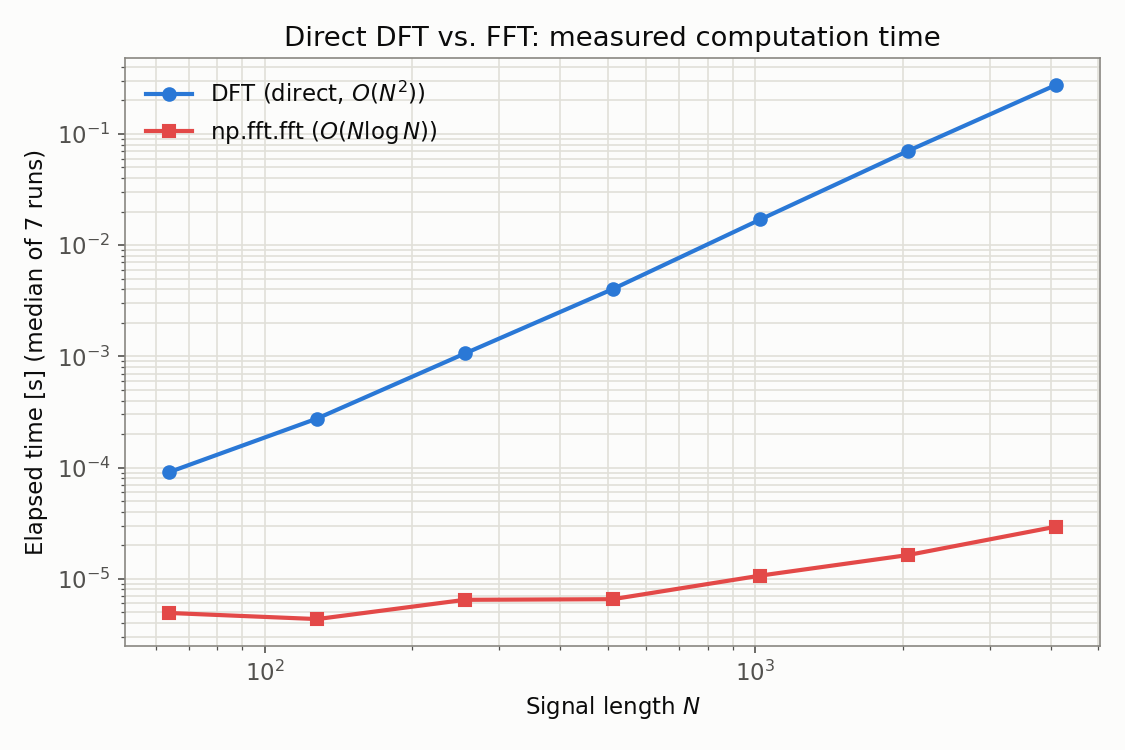
The figure shows the gap is only about \(18.5\times\) at \(N=64\) but widens to roughly \(9394\times\) at \(N=4096\) . Extrapolating with the theoretical table above, the gap reaches tens of thousands at \(N \approx 2^{20}\) .
Visualizing the DTFT (Bonus)
To inspect the spectrum between DFT bins, zero-pad the signal before the FFT — this samples the DTFT more densely without adding new information.
import numpy as np
import matplotlib.pyplot as plt

N = 32
n = np.arange(N)
x = np.cos(2 * np.pi * 0.1 * n)  # normalized frequency 0.1 cycles/sample

# DFT (N points)
X_dft = np.fft.fft(x)
freqs_dft = np.fft.fftfreq(N)

# DTFT approximation via zero padding (4096 points)
N_pad = 4096
X_dtft = np.fft.fft(x, n=N_pad)
freqs_dtft = np.fft.fftfreq(N_pad)

mask_dft = freqs_dft >= 0
mask_dtft = freqs_dtft >= 0

# Compare the peak location and magnitude of each spectrum
peak_dft = np.argmax(np.abs(X_dft[mask_dft]))
peak_dtft = np.argmax(np.abs(X_dtft[mask_dtft]))
print(f"DFT  peak: freq={freqs_dft[mask_dft][peak_dft]:.4f}  |X|={np.abs(X_dft[mask_dft])[peak_dft]:.2f}")
print(f"DTFT peak: freq={freqs_dtft[mask_dtft][peak_dtft]:.4f}  |X|={np.abs(X_dtft[mask_dtft])[peak_dtft]:.2f}")

plt.figure(figsize=(9, 4))
plt.plot(freqs_dtft[mask_dtft], np.abs(X_dtft[mask_dtft]),
         'b-', alpha=0.6, label='DTFT (zero-padded approx.)')
plt.stem(freqs_dft[mask_dft], np.abs(X_dft[mask_dft]),
         linefmt='r-', markerfmt='ro', basefmt=' ',
         label='DFT bins')
plt.xlabel('Normalized frequency [cycles/sample]')
plt.ylabel('Magnitude')
plt.title('DFT bins as samples of the continuous DTFT')
plt.legend()
plt.grid(True, alpha=0.3)
plt.tight_layout()
plt.savefig("dtft_visualization.png", dpi=150)
Output:
DFT  peak: freq=0.0938  |X|=15.39
DTFT peak: freq=0.1003  |X|=16.66
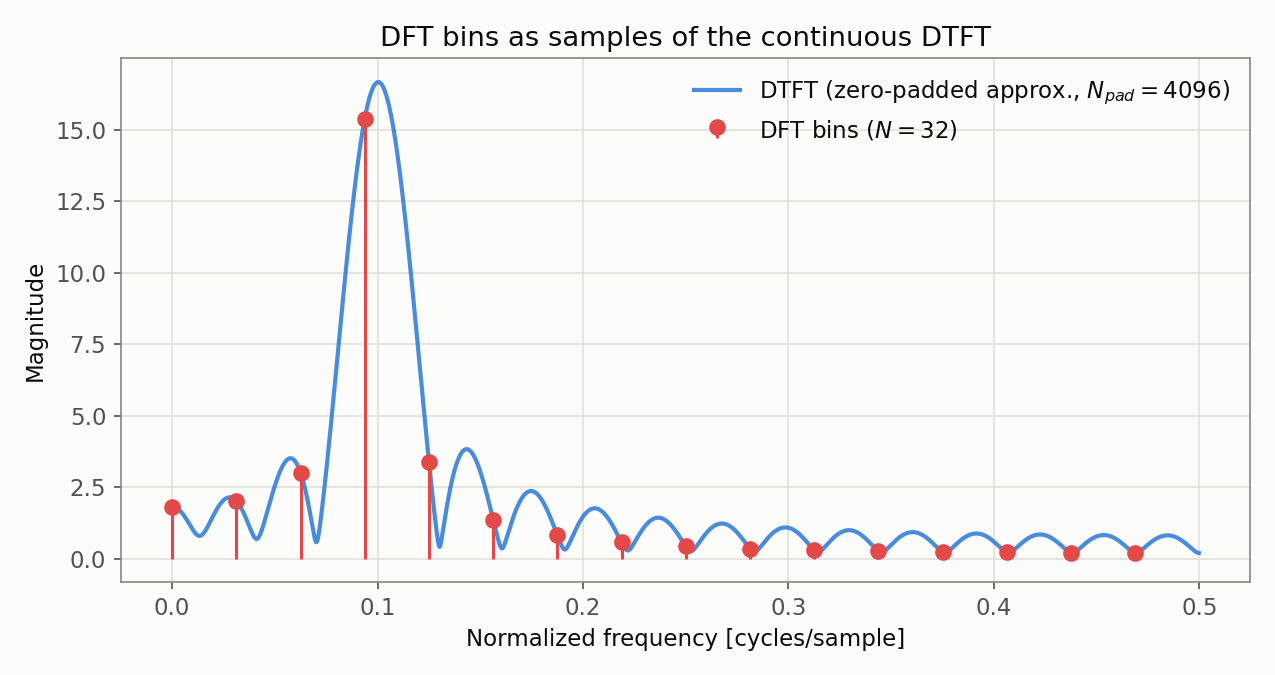
The plot makes it visually obvious that DFT bins (red) are samples of the continuous DTFT curve (blue). The measured values also make spectral leakage concrete. The signal’s true frequency is \(0.1\) cycles/sample, but with \(N=32\) the DFT bin spacing is \(\Delta f = 1/32 = 0.03125\) , and \(0.1 / 0.03125 = 3.2\) is not an integer. The signal’s period therefore does not divide evenly into the \(N\) -sample window, so the nearest DFT bin (\(k=3\) , \(f=0.0938\) ) only reaches magnitude \(15.39\) . The zero-padded DTFT, sampled much more densely, reaches its true peak near \(f=0.1003\) at magnitude \(16.66\) . The gap between the two,
\[ \frac{16.66 - 15.39}{16.66} \approx 7.6\% \]is exactly the amplitude underestimate that spectral leakage produces whenever the observed frequency does not land precisely on a DFT bin.
Summary
- The DTFT is the continuous-frequency representation of a discrete signal — the Z-transform restricted to the unit circle.
- The DFT is the DTFT sampled at \(N\) equally spaced frequencies — a finite, computable form.
- The FFT is an \(O(N \log N)\) algorithm for the DFT (the output equals the DFT exactly).
- For large \(N\) , the FFT is decisively faster — at \(N = 2^{20}\) the speedup is in the tens of thousands.
- Zero padding does not add information; it is dense sampling of the underlying DTFT.
Holding this hierarchy in mind makes downstream topics — windowing, PSD estimation, filter design — easier to navigate, because it is always clear which axis you are working on.
Related Articles
- Fast Fourier Transform (FFT): Theory and Python Implementation — A detailed derivation of Cooley-Tukey and a recursive Python implementation.
- Window Functions and Power Spectral Density — Mitigates the spectral leakage caused by the DFT’s finite length, and covers Welch’s PSD estimation.
- Sampling Theorem and Aliasing — The gateway from continuous to discrete signals; underpins the discrete-frequency notion used here.
- Z-Transform and Digital Filter Transfer Functions — The DTFT is the Z-transform on the unit circle; pole-zero geometry drives the frequency response.
- Short-Time Fourier Transform (STFT): Theory and Python Implementation — Slides the DFT/FFT along the time axis for time-frequency analysis; the natural extension for time-varying signals.
- Signal Interpolation and Resampling — Directly connects the DFT/FFT spectrum to how it changes under upsampling and interpolation.
- Autocorrelation Function and Power Spectral Density — Fast autocorrelation via the DFT/FFT and a practical application of the Wiener-Khinchin theorem.
- Convolution and Correlation: Theory and Python Implementation — The convolution theorem — time-domain convolution becomes frequency-domain multiplication — is a flagship application of the DTFT/DFT properties covered here.
- Discrete Cosine Transform (DCT) — The real-valued cousin of the DFT — useful for comparing energy-compaction properties.
- Filter Design: Comprehensive Guide — Hub for designing filters whose responses are evaluated via the DFT/FFT.
- Time-Frequency Analysis Guide — How the DFT/FFT extends to time-varying signals.
- DSP x ML Roadmap — Meta-roadmap placing the DFT/FFT as a starting point for the DSP-to-ML curriculum.
- Discrete DSP Fundamentals Roadmap — A hub connecting sampling, interpolation, DFT, Z-transform, autocorrelation, and DCT into one learning track. The DTFT→DFT→FFT hierarchy is its core.
References
- Cooley, J. W., & Tukey, J. W. (1965). “An algorithm for the machine calculation of complex Fourier series.” Mathematics of Computation, 19(90), 297-301.
- Oppenheim, A. V., & Schafer, R. W. (2009). Discrete-Time Signal Processing (3rd ed.). Prentice Hall.
- Proakis, J. G., & Manolakis, D. G. (2006). Digital Signal Processing (4th ed.). Prentice Hall.
- Fu, D. Y., Kumbong, H., Nguyen, E., & Ré, C. (2023). “FlashFFTConv: Efficient Convolutions for Long Sequences with Tensor Cores.” arXiv:2311.05908 (ICLR 2024). https://arxiv.org/abs/2311.05908
- NumPy FFT documentation