Introduction
“Remove the noise.” “Keep only this band.” “Smooth the waveform.” In real-world signal processing, the hardest question is often which filter to pick. Do you need linear phase? Real-time operation? Robustness to outliers? Different requirements change the optimal answer.
This article serves as a cross-cutting hub that consolidates 11+ filter articles on this blog. It organizes filter selection into three orthogonal axes (purpose, implementation form, priority metric), provides a characteristic-comparison matrix, walks through a use-case decision flow, gives a common evaluation framework built on the Bode plot , and links out to every detailed article. The goal is to provide a map for deciding “which one to use” in the shortest possible path, leaving the deep math to the individual posts.
Three Axes of Filter Selection
In practice, digital filter selection is most easily organized along three independent axes.
Axis 1: Purpose in the Frequency Domain (what to pass, what to block)
| Type | Passband | Typical use |
|---|---|---|
| Lowpass (LP) | \(f < f_c\) | Anti-aliasing, smoothing, low-frequency extraction |
| Highpass (HP) | \(f > f_c\) | DC removal, drift removal, edge enhancement |
| Bandpass (BP) | \(f_1 < f < f_2\) | Band extraction, demodulation |
| Bandstop (BS) | \(f < f_1\) or \(f > f_2\) | Broadband noise rejection |
| Notch | reject only \(f \approx f_0\) | Mains hum (50/60 Hz), narrowband interference |
| All-pass | pass everything (phase only changes) | Phase correction, group-delay equalization |
See lowpass , highpass , bandpass , and notch for details.
Axis 2: Implementation Form (FIR / IIR / fixed / adaptive)
| Class | Examples | Properties |
|---|---|---|
| FIR (fixed) | windowed, Parks–McClellan, moving average, Savitzky–Golay | Always stable, can be exactly linear-phase, more taps needed |
| IIR (fixed) | Butterworth, Chebyshev, Elliptic, Bessel | Steep with few coefficients, stability care required, nonlinear phase |
| Adaptive (time-varying) | LMS, RLS, Wiener | Tracks changing environments, needs desired/reference signal, convergence tuning |
| Nonlinear (robust) | median, bilateral, morphological | Outlier-robust, edge-preserving, outside linear theory |
The deep comparison between FIR and IIR lives in FIR vs IIR .
Axis 3: Priority Metric (what matters most)
The frequency response \(H(j\omega)\) has multiple metrics that trade off against one another.
| Metric | Definition | Where it matters |
|---|---|---|
| Passband flatness | \(\max_{f \in \text{pass}} \big\| \|H(jf)\| - 1 \big\|\) | Measurement, hi-fi audio, biomedical |
| Stopband attenuation | \(\min_{f \in \text{stop}} 20\log_{10}\|H(jf)\|\) | Anti-aliasing, interference rejection |
| Transition steepness | Roll-off [dB/oct] | Spectral separation, channelization |
| Phase linearity | \(\angle H(j\omega) \propto \omega\) | Audio, image, biomedical waveforms |
| Group-delay flatness | \(\tau_g(\omega) = -d\angle H/d\omega\) constant | Control systems, communications transients |
| Ripple tolerance | Passband/stopband ripple amplitude | Buys design freedom at a cost |
| Computational cost | Multiplies/adds per sample | Embedded, real-time |
Maximally flat passband → Butterworth. Steepest possible → Elliptic. Strict phase requirement → linear-phase FIR or Bessel. The mapping from priority metric to filter family practically writes itself.
Characteristic Comparison Matrix
Putting representative filters side by side makes selection obvious.
| Filter | Passband flatness | Stopband attenuation | Phase | Group delay | Compute | Typical use |
|---|---|---|---|---|---|---|
| Butterworth | Maximally flat | Gentle | Nonlinear | Moderate | Low | General-purpose LP/HP, measurement |
| Chebyshev I | Equiripple | Steep | Strongly bent | Larger | Low | Stopband matters more than passband |
| Chebyshev II | Flat | Equiripple | Moderate | Moderate | Low | Allowed ripple in stopband |
| Elliptic (Cauer) | Equiripple | Equiripple | Most nonlinear | Largest | Low | Minimum order for steepest cutoff |
| Bessel | Smooth | Gentle | Nearly linear | Most flat | Low | Transient response, control |
| Moving Average (MA) | \(\text{sinc}\) -shaped | Weak | Linear | \((N-1)/2\) | Tiny | Smoothing, trend extraction |
| EMA (exp. moving avg.) | 1st-order IIR LP | Gentle | Nonlinear | Small | Tiny | Real-time smoothing, tracking |
| Savitzky–Golay | Peak-preserving | Moderate | Linear | \((N-1)/2\) | Low | Spectroscopy, peak-preserving smooth |
| FIR (windowed) | Designable | Designable | Exactly linear | \((N-1)/2\) | Mid/High | Audio, image, biomedical |
| Median | Nonlinear | Nonlinear | Undefined | \((N-1)/2\) | Mid | Impulse removal, edge preservation |
| Wiener | Signal-stats dep. | Signal-stats dep. | MMSE-optimal | Design-dep. | Mid | Denoising, signal restoration |
| Adaptive (LMS/RLS) | Time-varying | Time-varying | Time-varying | Time-varying | Mid/High | Echo cancellation, interference |
| Complementary | Flat when summed | Flat when summed | Design-dep. | Design-dep. | Tiny | Sensor fusion (IMU attitude) |
Read this matrix column-first: pick the metric you must maximize and the best-in-column filter becomes your first candidate. “Most flat group delay” → Bessel. “Steepest cutoff” → Elliptic. “Linear phase with near-zero compute” → moving average.
Use-Case Decision Flow
Ten typical scenarios cover most decisions you’ll face in practice.
Scenario 1: Just smooth a waveform in real time
→ EMA (exponential moving average) wins. A 1st-order IIR needs 1 multiply + 1 add per sample, lightest possible. Lower \(\alpha\) for heavier smoothing.
Scenario 2: Offline phase-distortion-free smoothing
→ Moving average (MA)
or scipy.signal.filtfilt + any IIR. The former is exactly linear-phase; the latter is zero-phase (forward+backward pass cancels phase).
Scenario 3: Smooth without flattening peaks/edges
→ Savitzky–Golay filter . Local polynomial fitting preserves peak position and height far better than MA. The standard for chemistry and spectroscopy.
Scenario 4: Remove spike-like outlier noise
→ Median filter . Linear filters smear outliers across the window; median is order-statistic-based and removes a single spike completely while preserving edges.
Scenario 5: Need a steep roll-off (anti-aliasing, channel separation)
→ Elliptic for minimum order, Butterworth if no ripple is allowed (use higher order). Chebyshev sits in between.
Scenario 6: Linear phase is required (audio, biomedical waveforms, images)
→ Linear-phase FIR by default — coefficient symmetry guarantees exact linear phase, at the cost of more taps. If IIR is forced, Bessel is the next-best approximation.
Scenario 7: Minimize transient/step-response distortion (control, triggered measurement)
→ Bessel filter is optimal. Its maximally flat group delay means every frequency component is delayed identically, preserving waveform shape with minimal overshoot.
Scenario 8: Real-time, lightweight embedded implementation
→ EMA > MA > low-order Butterworth in increasing cost. Implement IIR as cascaded 2nd-order sections (SOS) for stability.
Scenario 9: Pinpoint removal of mains hum (50/60 Hz) or narrowband interference
→ Notch filter
. Narrower Q minimizes impact on surrounding signal. Trivial to design: one line with scipy.signal.iirnotch.
Scenario 10: Time-varying environment / reference signal available (echo cancellation, ANC, system ID)
→ Adaptive filter (LMS/RLS) . Fixed coefficients cannot track time-varying systems. If the MMSE-optimal solution is known a priori, the Wiener filter is the gold standard. For multi-sensor fusion, complementary filter trades optimality for almost zero compute.
Quick-Reference Tree
┌─ Outliers (impulses) dominate? ──> Median
│
├─ Strict linear phase required?
│   ├─ Yes ──> FIR (windowed / Parks-McClellan) or Bessel
│   └─ No
│       │
│       ├─ Steepest cutoff?      ──> Elliptic > Chebyshev > Butterworth
│       ├─ Flattest passband?    ──> Butterworth
│       └─ Best transient?       ──> Bessel
│
├─ Real-time + ultra-light?  ──> EMA / MA
├─ Peak-preserving smooth?   ──> Savitzky-Golay
├─ Mains hum removal?        ──> Notch
└─ Time-varying / reference? ──> Adaptive (LMS/RLS) / Wiener / Complementary
Design Parameter Selection
Cutoff Frequency Normalization
Most scipy.signal calls accept a normalized frequency \(W_n = f_c / (f_s/2)\)
, with \(f_s\)
the sampling rate and \(W_n \in (0, 1)\)
. Pass fs= to specify physical frequencies directly — fewer off-by-two errors.
Order Selection Rule
Given passband attenuation \(A_p\)
[dB], stopband attenuation \(A_s\)
[dB], passband edge \(f_p\)
, and stopband edge \(f_s\)
, scipy.signal.iirdesign computes the required order and coefficients automatically.
from scipy import signal

# Spec: fs=1000Hz, ≤1dB ripple up to 80Hz passband edge,
#        ≥40dB attenuation beyond 120Hz stopband edge.
sos = signal.iirdesign(
    wp=80, ws=120, gpass=1.0, gstop=40.0, fs=1000.0,
    ftype="ellip",  # 'butter' / 'cheby1' / 'cheby2' / 'ellip' / 'bessel'
    output="sos",
)
Rule of thumb: start by giving only the spec to iirdesign. Hand-pick the order via butter/cheby1/ellip/bessel only when you need fine control.
Ripple Tolerance
rp (passband ripple [dB]) applies to Chebyshev I / Elliptic; rs (stopband attenuation [dB]) to Chebyshev II / Elliptic. 1 dB of passband ripple is inaudible but often forbidden for instrumentation. Allowing ripple lets you reduce the order — that’s the trade-off.
Group-Delay Constraint
If group delay must stay below a bound, look first at Bessel. If still insufficient, cascade an all-pass network to equalize phase. Use scipy.signal.group_delay((b, a), w=...) to evaluate.
FIR Order Heuristic
For a Kaiser-window FIR, given transition width \(\Delta f\) and stopband attenuation \(A_s\) [dB], the required order is approximately
\[ N \approx \frac{A_s - 8}{2.285 \, \cdot 2\pi \, \Delta f / f_s} \tag{1} \]Design with scipy.signal.firwin(N, fc, fs=fs, window=("kaiser", beta)), or use the more powerful signal.remez (Parks–McClellan).
from scipy import signal

# FIR lowpass: 1024 taps, cutoff 100Hz, Hamming window
taps = signal.firwin(1024, cutoff=100, fs=1000.0, window="hamming")

# Median filter: window size 5
y = signal.medfilt(x, kernel_size=5)
Common Evaluation Framework
Whatever filter you design, the standard evaluation is to plot four things side by side: impulse response, frequency response (
Bode plot
), group delay, step response. The skeleton below takes any IIR/FIR coefficients (b, a) and produces all four.
import numpy as np
import matplotlib.pyplot as plt
from scipy import signal


def evaluate_filter(b, a, fs=1000.0, n_impulse=128, title="Filter"):
    """Four-panel evaluation of any IIR/FIR filter."""
    # 1) Impulse response
    impulse = np.zeros(n_impulse)
    impulse[0] = 1.0
    h_imp = signal.lfilter(b, a, impulse)

    # 2) Frequency response (Bode)
    w, h = signal.freqz(b, a, worN=4096, fs=fs)
    mag_db = 20 * np.log10(np.abs(h) + 1e-12)
    phase_deg = np.degrees(np.unwrap(np.angle(h)))

    # 3) Group delay
    w_gd, gd = signal.group_delay((b, a), w=4096, fs=fs)

    # 4) Step response
    step = np.ones(n_impulse)
    h_step = signal.lfilter(b, a, step)

    fig, axes = plt.subplots(2, 2, figsize=(12, 8))

    axes[0, 0].stem(np.arange(n_impulse), h_imp, basefmt=" ")
    axes[0, 0].set_title("Impulse Response")
    axes[0, 0].set_xlabel("n [samples]")
    axes[0, 0].grid(alpha=0.3)

    ax_m = axes[0, 1]
    ax_m.semilogx(w, mag_db, label="Magnitude [dB]")
    ax_m.set_ylim(-80, 5)
    ax_m.set_title("Bode (Magnitude)")
    ax_m.set_xlabel("Frequency [Hz]")
    ax_m.grid(True, which="both", alpha=0.3)

    axes[1, 0].semilogx(w_gd, gd)
    axes[1, 0].set_title("Group Delay [samples]")
    axes[1, 0].set_xlabel("Frequency [Hz]")
    axes[1, 0].grid(True, which="both", alpha=0.3)

    axes[1, 1].plot(np.arange(n_impulse), h_step)
    axes[1, 1].axhline(1.0, color="gray", linestyle=":")
    axes[1, 1].set_title("Step Response")
    axes[1, 1].set_xlabel("n [samples]")
    axes[1, 1].grid(alpha=0.3)

    fig.suptitle(title)
    plt.tight_layout()
    plt.show()


# Side-by-side comparison: same cutoff, same order, four families
fs, fc, N = 1000.0, 100.0, 4
for name, design in [
    ("Butterworth", signal.butter(N, fc, fs=fs, output="ba")),
    ("Chebyshev I", signal.cheby1(N, 1.0, fc, fs=fs, output="ba")),
    ("Elliptic", signal.ellip(N, 1.0, 40.0, fc, fs=fs, output="ba")),
    ("Bessel", signal.bessel(N, fc, fs=fs, norm="mag", output="ba")),
]:
    b, a = design
    evaluate_filter(b, a, fs=fs, title=f"{name} N={N}, fc={fc}Hz")
Run this framework on candidate filters and you immediately see: Butterworth’s flat passband, Chebyshev’s ripple, Elliptic’s steepest roll-off, Bessel’s flat group delay and clean step response. Whenever in doubt, drop the candidates into this skeleton and decide visually.
Actually Quantifying the Four Filters
evaluate_filter() only plots — to compare passband variation, stopband attenuation, group delay, and overshoot numerically, you need code that computes and prints the metrics. Below is code actually run against the same design (\(N=4\)
, \(f_c=100\)
Hz, \(f_s=1000\)
Hz), producing both numbers and a figure.
import numpy as np
import matplotlib.pyplot as plt
from scipy import signal

fs, fc, N = 1000.0, 100.0, 4
n_impulse = 128

designs = {
    "Bessel": signal.bessel(N, fc, fs=fs, norm="mag", output="ba"),
    "Butterworth": signal.butter(N, fc, fs=fs, output="ba"),
    "Chebyshev I": signal.cheby1(N, 1.0, fc, fs=fs, output="ba"),
    "Elliptic": signal.ellip(N, 1.0, 40.0, fc, fs=fs, output="ba"),
}

print(f"{'Filter':12s} {'PB var[dB]':>10s} {'Atten@200Hz[dB]':>16s} "
      f"{'GD mean[ms]':>12s} {'GD span[ms]':>12s} {'Overshoot[%]':>13s} {'settle@n=127':>13s}")

for name, (b, a) in designs.items():
    w, h = signal.freqz(b, a, worN=4096, fs=fs)
    mag_db = 20 * np.log10(np.abs(h) + 1e-12)
    w_gd, gd = signal.group_delay((b, a), w=4096, fs=fs)
    gd_ms = gd / fs * 1000.0
    step = np.ones(n_impulse)
    h_step = signal.lfilter(b, a, step)

    pb = (w >= 1) & (w <= 90)
    pb_var = mag_db[pb].max() - mag_db[pb].min()
    atten_200 = np.interp(200.0, w, mag_db)

    gdpb = (w_gd >= 1) & (w_gd <= 90)
    gd_pb = gd_ms[gdpb]
    gd_mean, gd_span = gd_pb.mean(), gd_pb.max() - gd_pb.min()

    overshoot = (h_step.max() - 1.0) * 100.0
    settle = h_step[-1]

    print(f"{name:12s} {pb_var:10.3f} {atten_200:16.2f} "
          f"{gd_mean:12.3f} {gd_span:12.3f} {overshoot:13.2f} {settle:13.4f}")
Output:
Filter        PB var[dB]  Atten@200Hz[dB]  GD mean[ms]  GD span[ms]  Overshoot[%]  settle@n=127
Bessel             2.360           -16.34        3.340        0.244          2.18        1.0000
Butterworth        1.484           -27.97        4.848        2.501         11.91        1.0000
Chebyshev I        1.000           -38.27        5.697        6.302          9.23        0.8912
Elliptic           1.000           -40.88        5.186        7.256         11.00        0.8912
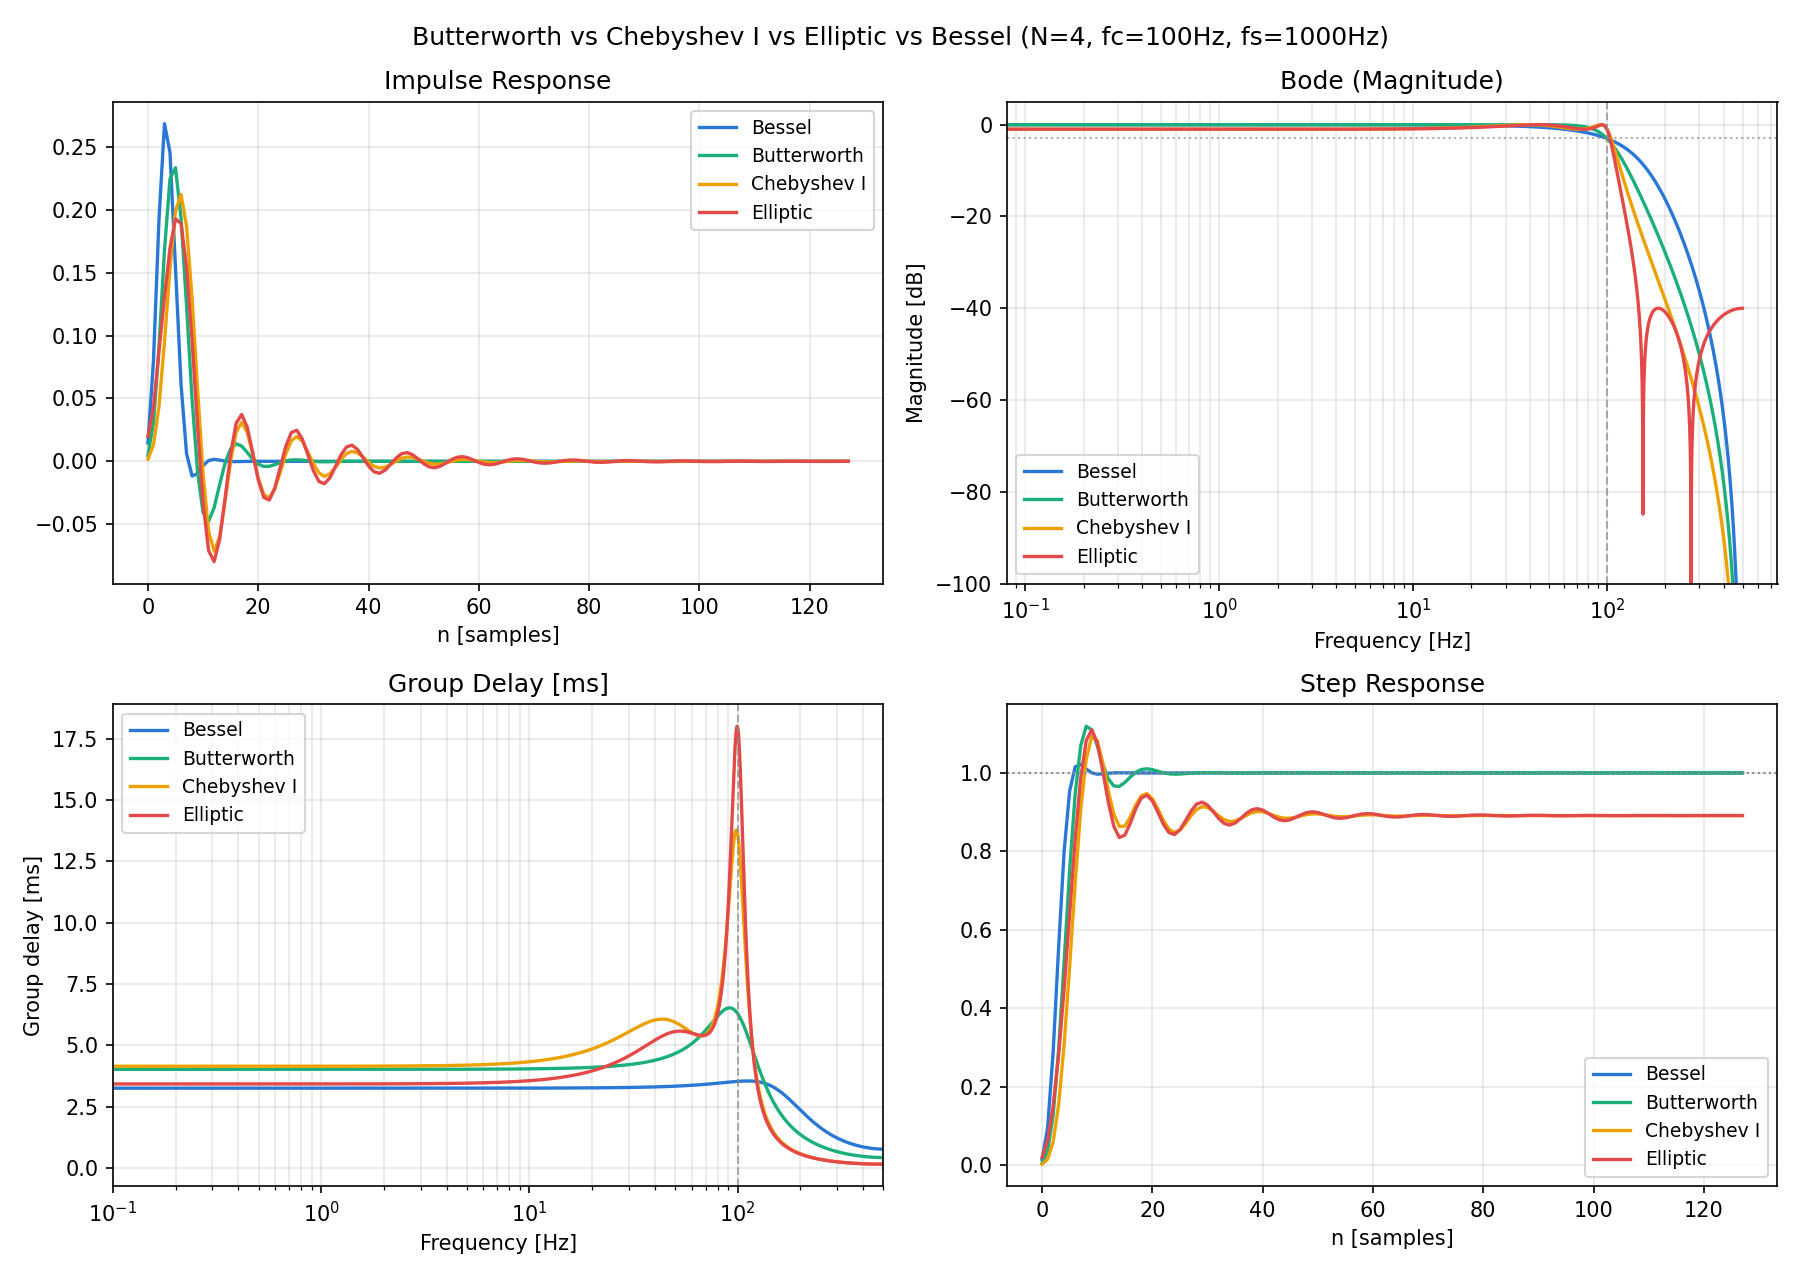
Cross-checking the numbers against the figure confirms Axis 3’s claims quantitatively. Bessel’s group-delay span is by far the smallest at \(0.244\) ms (about 1/10 of Butterworth’s, about 1/30 of Elliptic’s), and its step-response overshoot is correspondingly minimal at \(2.18\%\) . Butterworth and Elliptic, meanwhile, show nearly the same overshoot (\(11\) –\(12\%\) ) — overshoot magnitude alone cannot distinguish “flat-passband-first” Butterworth from “steepness-first” Elliptic.
Pitfall: equiripple filters don’t always converge to 1.0
Look closely at the numbers and figure above: Chebyshev I and Elliptic sit at \(0.8912\) at \(n=127\) , never reaching \(1.0\) the way Bessel and Butterworth do. Is the simulation window simply too short, or is this the true steady state? Extend it to \(n=2000\) to find out.
import numpy as np
from scipy import signal

fs, fc, N = 1000.0, 100.0, 4
designs = {
    "Chebyshev I": signal.cheby1(N, 1.0, fc, fs=fs, output="ba"),
    "Elliptic": signal.ellip(N, 1.0, 40.0, fc, fs=fs, output="ba"),
}
step = np.ones(2000)
for name, (b, a) in designs.items():
    y = signal.lfilter(b, a, step)
    print(f"{name:12s} y[127]={y[127]:.4f}  y[300]={y[300]:.4f}  y[1999]={y[1999]:.6f}")
Output:
Chebyshev I  y[127]=0.8912  y[300]=0.8913  y[1999]=0.891251
Elliptic     y[127]=0.8912  y[300]=0.8913  y[1999]=0.891251
Even at \(n=1999\) the value stays at \(0.891251\) . This is not incomplete convergence — it is the genuine DC (\(\Omega=0\) ) gain.
As shown in the Chebyshev filter article , the Type I magnitude response is
\[ |H(j\Omega)|^2 = \frac{1}{1+\varepsilon^2 T_N^2(\Omega)} \]and the Chebyshev polynomial’s parity
\[ T_N(-\Omega) = (-1)^N T_N(\Omega) \]forces \(T_N(0)=0\) for odd \(N\) or \(T_N(0)=\pm1\) for even \(N\) . Hence the DC gain is \(1\) (\(0\) dB) for odd order and \(1/\sqrt{1+\varepsilon^2}=10^{-R_p/20}\) for even order. With \(R_p=1\) dB, \(10^{-1/20}=0.8913\) , matching the measurement above.
Elliptic (Cauer) filters use the same equiripple characteristic-function template, replacing \(T_N\) with the elliptic rational function \(R_N(\Omega; L)\) :
\[ |H(j\Omega)|^2 = \frac{1}{1+\varepsilon^2 R_N^2(\Omega; L)} \]\(R_N\) is built from the same “best equiripple approximation” construction principle as \(T_N\) , so it shares the same parity
\[ R_N(-\Omega) = (-1)^N R_N(\Omega) \]Consequently, the exact same odd/even rule holds: \(R_N(0)=0\) (DC gain \(1\) ) for odd \(N\) , \(R_N(0)=\pm1\) (DC gain \(10^{-R_p/20}\) ) for even \(N\) . Sweeping the order confirms this prediction exactly.
from scipy import signal
import numpy as np

fs, fc = 1000.0, 100.0
for N in [3, 4, 5, 6]:
    b, a = signal.cheby1(N, 1.0, fc, fs=fs, output="ba")
    dc_cheby = np.abs(signal.freqz(b, a, worN=[0], fs=fs)[1][0])
    be, ae = signal.ellip(N, 1.0, 40.0, fc, fs=fs, output="ba")
    dc_ellip = np.abs(signal.freqz(be, ae, worN=[0], fs=fs)[1][0])
    print(f"N={N} ({'odd' if N % 2 else 'even'}): "
          f"Chebyshev I DC={dc_cheby:.4f} ({20*np.log10(dc_cheby):+.3f} dB)  "
          f"Elliptic DC={dc_ellip:.4f} ({20*np.log10(dc_ellip):+.3f} dB)")
Output:
N=3 (odd):  Chebyshev I DC=1.0000 (-0.000 dB)  Elliptic DC=1.0000 (+0.000 dB)
N=4 (even): Chebyshev I DC=0.8913 (-1.000 dB)  Elliptic DC=0.8913 (-1.000 dB)
N=5 (odd):  Chebyshev I DC=1.0000 (+0.000 dB)  Elliptic DC=1.0000 (-0.000 dB)
N=6 (even): Chebyshev I DC=0.8913 (-1.000 dB)  Elliptic DC=0.8913 (-1.000 dB)
Exactly as predicted: both filter families sit at \(0\)
dB DC gain for odd order and \(-R_p\)
dB (here \(-1\)
dB) for even order. When benchmarking multiple filter families side by side as this article does, equiripple designs (Chebyshev I/II, Elliptic) can shift their final value purely based on order parity — don’t mistake “step response hasn’t reached 1.0” for “not yet converged.” In practice, either match all candidates to the same order parity, or check the DC gain directly with 20 * np.log10(np.abs(signal.freqz(b, a, worN=[0])[1][0])) before drawing conclusions.
Note also that all the code above uses output="ba" (transfer-function coefficients), which is fine at a modest order like \(N=4\)
. Beyond roughly order 8, the ba form becomes numerically fragile due to coefficient round-off — as also noted in the
Butterworth
and
Bessel
articles, switching to output="sos" with sosfilt/sosfreqz is the standard practice.
For deeper reading on frequency response, see Bode plot ; to combine with input spectrum analysis, see FFT and windowing + PSD .
Recent Research
Recent work is blurring the line between fixed-coefficient IIR and adaptive filtering. Rota, Ratmanski, Coldenhoff, & Cernak (2026) propose TVF (Time-Varying Filtering) for on-device speech enhancement in hearing aids: a lightweight neural controller predicts, in real time, the coefficients of a differentiable cascade of 35 second-order IIR sections. With only 24k parameters and 10.7 ms latency, it runs entirely on-device while keeping each SOS section interpretable as an explicit equalizer curve (arXiv:2603.02794). This is a direct extension of the classic cascaded second-order-section (SOS) IIR implementation discussed in Scenario 8 of this article — instead of fixed coefficients, a neural network generates them dynamically, showing that the fixed-vs-adaptive boundary drawn in Axis 2 of this hub is increasingly being rewritten by hybrid designs.
Separately, Javadi, Rezaee, Nabavi, Gadringer, & Bösch (2025) train machine learning models (notably XGBoost) to predict the physical parameters of microwave filters (iris widths, resonator lengths) directly from specifications, reporting over 90% agreement between the ML-predicted values and the final optimized values (Electronics, 14(2), 367). This extends the “give it the spec, get the coefficients” automation philosophy of scipy.signal.iirdesign into the physical parameter design of hardware filters.
Related Articles Guide
Here is the full catalog, grouped by category with a one-line positioning.
IIR Family (fixed coefficients, low compute, steep)
- Butterworth filter design with Python — maximally flat passband, the default for general LP/HP.
- Chebyshev filter design with Python — buy steepness with ripple.
- Elliptic (Cauer) filter design and characteristics — steepest for given order, ripple in both bands.
- Bessel filter theory and Python implementation — maximally flat group delay, ideal for transient-sensitive systems.
By Frequency Specification
- Lowpass filter design and comparison — best entry point, contrasts Butterworth/Chebyshev/Elliptic.
- Highpass filter design with Python — DC removal and drift removal staple.
- Bandpass filter design with Python — band extraction, demodulation front-end.
- Notch filter design with Python — mains hum removal, Q-factor design.
FIR / Averaging Family (linear phase, lightweight)
- FIR vs IIR filter comparison — stability, linear phase, and compute trade-offs.
- Moving average filter: mechanism and implementation — simplest FIR, exactly linear phase.
- Exponential moving average (EMA) theory and Python — 1st-order IIR, the lightest real-time smoother.
- Savitzky–Golay filter theory and implementation — local polynomial fitting for peak-preserving smoothing.
Adaptive / Statistical Family (time-varying, optimization-based)
- Adaptive filter (LMS/RLS) theory and Python — the heart of echo cancellation and system ID.
- The RLS Algorithm in Python: Recursive Least Squares and Its Equivalence to the Kalman Filter — derives RLS from the matrix inversion lemma and demonstrates its equivalence to the Kalman filter.
- Wiener filter theory and implementation — MMSE-optimal, the gold standard for denoising and restoration.
- Complementary filter theory and implementation — lightweight sensor fusion for IMU attitude estimation.
Special Purpose / Nonlinear
- Median filter theory and Python implementation — outlier removal and edge preservation, the canonical nonlinear filter.
Real-time implementation
- Streaming IIR filters with SOS
— carry
sosfiltstate between blocks to avoid boundary transients, and distinguish causal filtering from offlinesosfiltfilt.
Evaluation / Analysis Tools
- Bode plot: reading and creating frequency response diagrams — the common language for all filter responses.
- Fast Fourier Transform (FFT) with Python — essential for pre/post-filter spectrum comparison.
- Window functions and PSD estimation — leakage suppression and power-spectral-density estimation.
Summary
- Filter selection becomes tractable when organized along three axes: purpose, implementation form, and priority metric.
- Read the characteristic comparison matrix column-first: the best filter for your top-priority metric is immediately visible.
- The use-case decision tree pivots on outlier handling (Median), linear phase (FIR/Bessel), steepness (Elliptic), embedded real-time (EMA/MA), and time-varying systems (Adaptive).
- For design, give the spec to
scipy.signal.iirdesignand let it minimize the order automatically. - Always evaluate with the four-panel framework: impulse response, Bode plot , group delay, step response.
For the mathematics and implementation details of each filter, follow the related articles above — every one is designed to drill down vertically from this hub.
References
- Oppenheim, A. V., & Schafer, R. W. (2009). Discrete-Time Signal Processing (3rd ed.). Prentice Hall.
- Proakis, J. G., & Manolakis, D. G. (2006). Digital Signal Processing: Principles, Algorithms, and Applications (4th ed.). Prentice Hall.
- Parks, T. W., & Burrus, C. S. (1987). Digital Filter Design. Wiley.
- Smith, S. W. (1997). The Scientist and Engineer’s Guide to Digital Signal Processing. California Technical Publishing.
- scipy.signal — SciPy documentation
- Rota, R., Ratmanski, K., Coldenhoff, J., & Cernak, M. (2026). An Interpretable, Controllable Time-Varying IIR Denoiser for On-Device Assistive Hearing. arXiv:2603.02794. https://arxiv.org/abs/2603.02794
- Javadi, S., Rezaee, B., Nabavi, S. S., Gadringer, M. E., & Bösch, W. (2025). Machine Learning-Driven Approaches for Advanced Microwave Filter Design. Electronics, 14(2), 367. https://doi.org/10.3390/electronics14020367
Related Tools
- DevToolBox - Free Tools for Developers - 85+ tools including JSON formatter and regex tester
- CalcBox - Everyday Calculator Tools - 61+ tools including statistics and frequency conversion