Why a Roadmap
Digital signal processing (DSP) and machine learning (ML) each contain a vast number of methods, and learners often stall on where to start. In practice the pipeline is “sensor data → preprocessing (filter) → features → ML model”, so you need a path that interleaves the two.
This blog has built five aggregation hubs over the past cycles:
- https://yuhi-sa.github.io/en/posts/20260521_bode_plot/1/ — Bode plot hub
- https://yuhi-sa.github.io/en/posts/20260522_monte_carlo_optimization/1/ — Monte Carlo optimization hub
- https://yuhi-sa.github.io/en/posts/20260522_filter_design_guide/1/ — Filter design guide hub
- https://yuhi-sa.github.io/en/posts/20260524_time_frequency_guide/1/ — Time-frequency analysis hub
- https://yuhi-sa.github.io/en/posts/20260525_ml_timeseries_guide/1/ — ML time-series hub
This article ties them together as a level- and goal-oriented learning roadmap.
1. Hub Overview
| Hub | Scope | Prerequisites | Key APIs |
|---|---|---|---|
| Bode plot | Frequency response, gain/phase, transfer function | Complex numbers, basic Laplace | scipy.signal.bode, scipy.signal.TransferFunction, numpy.angle |
| Monte Carlo Opt | CEM / SA / GA / MPPI, stochastic search | Probability, numpy | numpy.random, scipy.optimize |
| Filter Design | IIR/FIR, Butterworth/Chebyshev/Bessel, Notch/Bandpass | Frequency-domain intuition | scipy.signal.butter, firwin, iirnotch, freqz, lfilter |
| Time-Frequency | STFT/Wavelet/Hilbert/Mode decomposition | Filter design + Fourier | scipy.signal.stft, pywt.cwt, scipy.signal.hilbert, PyEMD.EMD, vmdpy.VMD |
| ML Time-Series | k-means/GMM/RF/GBDT/LSTM/Kalman/IsolationForest | numpy, basic probability | sklearn.cluster.KMeans, RandomForestClassifier, keras.layers.LSTM, IsolationForest |
2. Learning Path Diagram
[Basic Math]
  │ complex numbers, linear algebra, probability
  ↓
[Fourier Analysis] ── FFT intro ──┐
  │                                │
  ↓                                ↓
[Bode Plot Hub]       [Filter Design Hub]
  │                                │
  └──────────┬─────────────────────┘
             ↓
   [Time-Frequency Hub]
             │
             ↓
   [ML Time-Series Hub] ← [Monte Carlo Opt Hub]
             │             (hyperparameter tuning)
             ↓
        [Applications]
3. Level-Based Tracks
Level 1: Complete Beginner
Goal: get comfortable with Python, numpy, matplotlib.
- https://yuhi-sa.github.io/en/posts/20260223_matplotlib_tips/1/ — matplotlib essentials
- https://yuhi-sa.github.io/en/posts/20210514_py_print/1/ — Python
printoverwriting - https://yuhi-sa.github.io/en/posts/20260225_fft/1/ — FFT introduction
- https://yuhi-sa.github.io/en/posts/20260225_moving_average/1/ — moving averages
- https://yuhi-sa.github.io/en/posts/20220206_ema/1/ — EMA frequency response
Estimated 2–4 weeks.
Level 2: With Math Basics
Goal: build intuition for frequency response and filter design.
- https://yuhi-sa.github.io/en/posts/20260521_bode_plot/1/
- https://yuhi-sa.github.io/en/posts/20260223_lowpass_filter/1/
- https://yuhi-sa.github.io/en/posts/20260226_butterworth/1/
- https://yuhi-sa.github.io/en/posts/20260314_chebyshev_filter/1/
- https://yuhi-sa.github.io/en/posts/20260316_bessel_filter/1/
- https://yuhi-sa.github.io/en/posts/20260226_fir_iir/1/
- https://yuhi-sa.github.io/en/posts/20260522_filter_design_guide/1/
Estimated 4–8 weeks.
Level 3: Python-Comfortable
Goal: master time-frequency analysis for non-stationary signals.
- https://yuhi-sa.github.io/en/posts/20260429_stft/1/
- https://yuhi-sa.github.io/en/posts/20260226_wavelet/1/
- https://yuhi-sa.github.io/en/posts/20260522_wavelet_packet/1/
- https://yuhi-sa.github.io/en/posts/20260318_hilbert_transform/1/
- https://yuhi-sa.github.io/en/posts/20260528_mode_decomposition/1/
- https://yuhi-sa.github.io/en/posts/20260524_time_frequency_guide/1/
Estimated 8–12 weeks.
Level 4: Applied Practitioner
Goal: combine ML and stochastic optimization with DSP.
- https://yuhi-sa.github.io/en/posts/20260228_timeseries_anomaly/1/
- https://yuhi-sa.github.io/en/posts/20260226_kmeans_gmm/1/
- https://yuhi-sa.github.io/en/posts/20260226_ensemble_learning/1/
- https://yuhi-sa.github.io/en/posts/20260317_lstm_timeseries/1/
- https://yuhi-sa.github.io/en/posts/20260525_ml_timeseries_guide/1/
- https://yuhi-sa.github.io/en/posts/20260223_bayesian_optimization/1/
- https://yuhi-sa.github.io/en/posts/20210329_cem/1/
- https://yuhi-sa.github.io/en/posts/20260226_genetic_algorithm/1/
- https://yuhi-sa.github.io/en/posts/20260215_mppi/1/
- https://yuhi-sa.github.io/en/posts/20260522_monte_carlo_optimization/1/
Estimated 12–20 weeks.
4. Field-Specific Depth Order
- A. Frequency response → filter design:
scipy.signal.TransferFunction→bode→butter→cheby1/2→bessel→iirnotch. - B. Fourier → Time-frequency:
numpy.fft.fft→scipy.signal.windows→welch→stft→pywt.cwt→hilbert→PyEMD.EMD/vmdpy.VMD. - C. State estimation: Kalman → EKF → UKF → Particle filter → RTS smoother.
- D. ML time-series:
KMeans→GaussianMixture→RandomForestClassifier→GradientBoostingClassifier→keras.layers.LSTM→IsolationForest. - E. Stochastic optimization:
numpy.random→scipy.optimize.minimize→ CEM → SA → GA → MPPI → Bayesian optimization (scikit-optimize).
5. Cross-Cutting Topics
- Feature engineering: STFT band-power, Wavelet energy, HHT instantaneous frequency as feature vectors for RandomForest classification.
- Anomaly detection: Notch + STFT preprocessing → IsolationForest scoring.
- Forecasting: SSA trend removal → LSTM short-term prediction.
- Hyperparameter tuning: Bayesian optimization for filter cutoff or LSTM hidden size.
See each hub’s “Applications” section and the integrated evaluation code in https://yuhi-sa.github.io/en/posts/20260525_ml_timeseries_guide/1/.
6. Head-to-Head: Solving One Task with FFT, Kalman, and Wavelet Hubs
The chapters so far were about which hub to learn, and in what order. But the question practitioners actually get stuck on comes after the learning path is finished: “which hub’s tool do I pick for this specific problem?” This section puts the roadmap’s philosophy into practice by solving one concrete task with all three methods — the FFT hub, the state-estimation hub (Kalman), and the time-frequency hub (Wavelet) — and measuring their accuracy, robustness, and computational cost on the same data. This is not a re-derivation of any single method (see https://yuhi-sa.github.io/en/posts/20260225_fft/1/, https://yuhi-sa.github.io/en/posts/20260224_kalman_filter/1/, and https://yuhi-sa.github.io/en/posts/20260226_wavelet/1/ for the theory); the point is to see what actually happens when three mature tools are placed on the same field.
Task: tracking a step change in a known-frequency component buried in noise
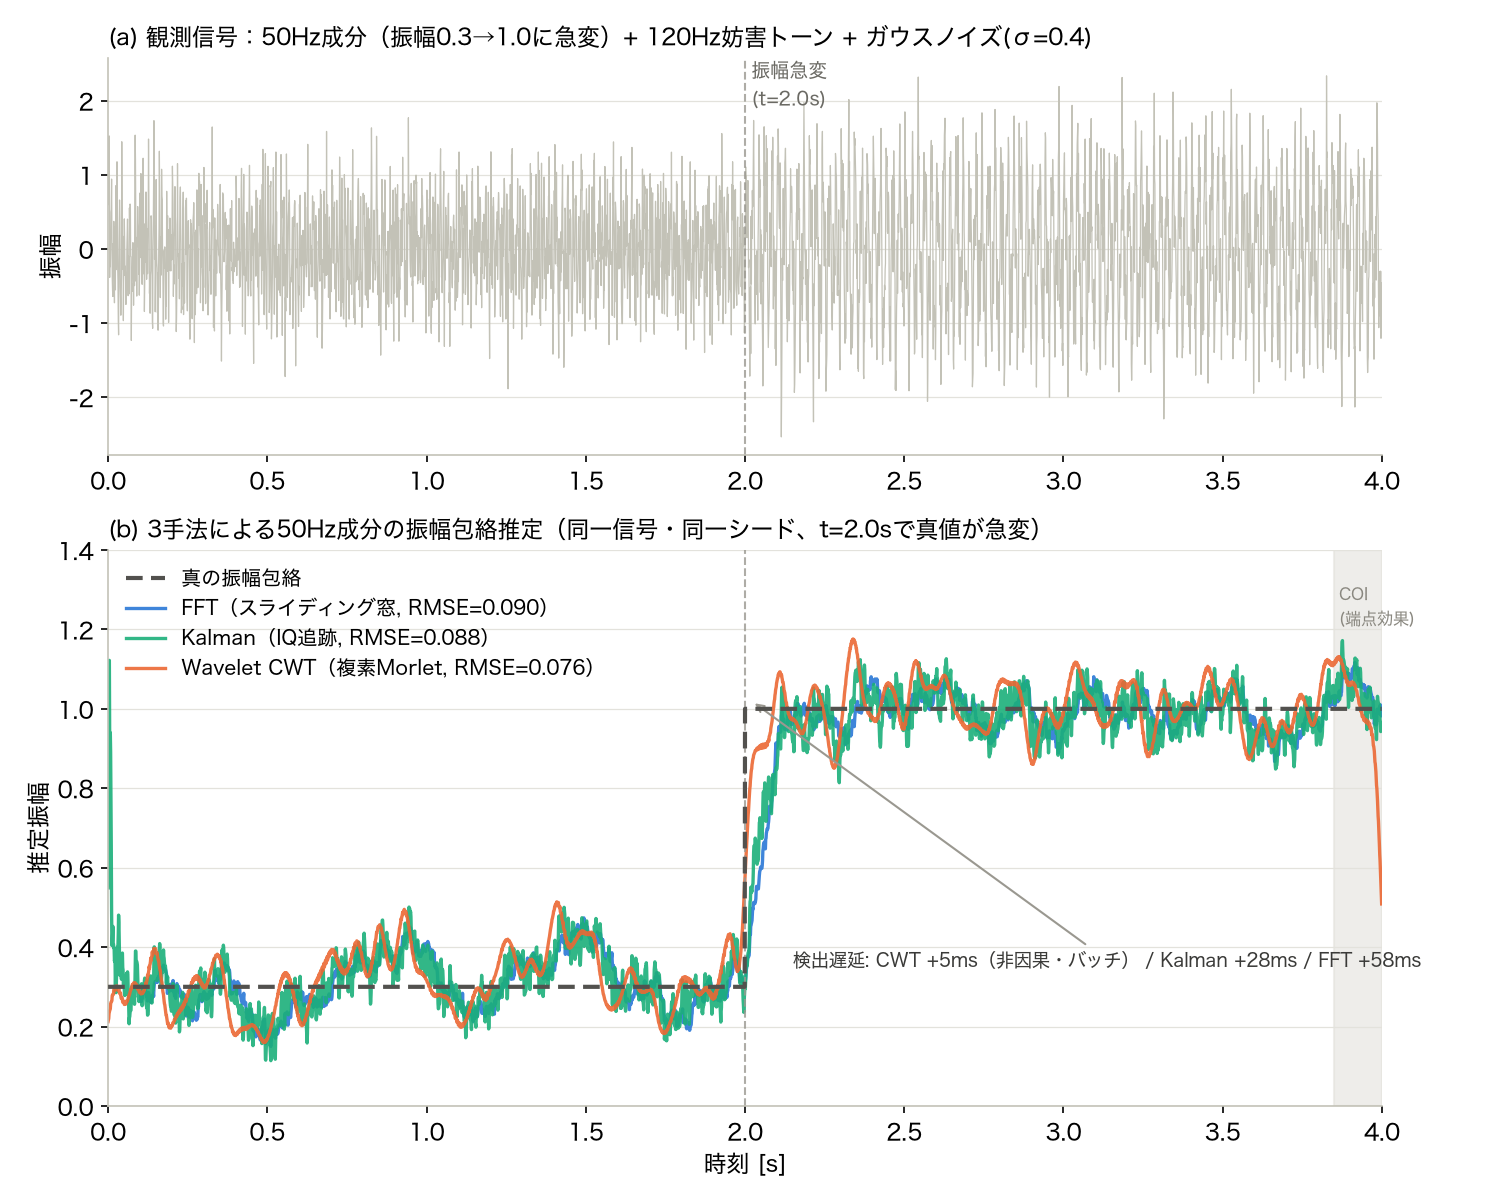
The scenario models a bearing-fault characteristic frequency (50 Hz) that suddenly strengthens at some point in time. A 120 Hz interfering tone (the same frequency used in the https://yuhi-sa.github.io/en/posts/20260225_fft/1/ article) and Gaussian noise are added, and the 50 Hz amplitude steps from 0.3 to 1.0 at \(t=2.0\) s.
import numpy as np
from scipy.signal import stft
import pywt
import time

np.random.seed(0)
fs = 1000.0          # sampling rate [Hz]
T = 4.0              # signal length [s]
N = int(fs * T)
t = np.arange(N) / fs
f0 = 50.0            # target known frequency (bearing-fault characteristic frequency)
f_interferer = 120.0 # interfering tone

A_true = np.where(t < 2.0, 0.3, 1.0)  # true amplitude envelope: step change at t=2.0s
x_clean = A_true * np.sin(2 * np.pi * f0 * t) + 0.5 * np.sin(2 * np.pi * f_interferer * t)
noise_sigma = 0.4
x = x_clean + noise_sigma * np.random.randn(N)
w0 = 2 * np.pi * f0 / fs
All three methods are asked the same question: “estimate the amplitude of the 50 Hz component at time \(t\) .”
Method 1: FFT (sliding-window single-bin extraction, causal)
With window length \(L=100\) samples (100 ms = 5 cycles), the bin spacing \(f_s/L=10\) Hz places both 50 Hz and 120 Hz exactly on bins, so a rectangular window extracts them without leakage.
L = 100
cos_ref = np.cos(w0 * np.arange(L))
sin_ref = np.sin(w0 * np.arange(L))
amp_fft = np.full(N, np.nan)
for n in range(L, N + 1):
    seg = x[n - L:n]
    c, s = seg @ cos_ref, seg @ sin_ref
    amp_fft[n - 1] = (2.0 / L) * np.sqrt(c ** 2 + s ** 2)
Method 2: Kalman filter (single-frequency IQ tracking, sequential, causal)
The https://yuhi-sa.github.io/en/posts/20260224_kalman_filter/1/ article’s state vector was position/velocity \([p, v]^T\) . Here, for amplitude tracking, the state is the IQ pair \([a_k, b_k]^T\) rotating at the known angular frequency \(\omega_0\) . The observation model is a dot product with the reference waveforms \(\cos(\omega_0 k), \sin(\omega_0 k)\) at each step:
\[ y_k = a_k \cos(\omega_0 k) + b_k \sin(\omega_0 k) + v_k \]Letting \(a_k, b_k\) drift slowly via a random walk (process noise \(Q\) ) lets the filter track abrupt amplitude changes. The amplitude estimate is \(\sqrt{a_k^2 + b_k^2}\) .
def run_kalman(x, w0, q, r):
    n = len(x)
    xk, P = np.zeros(2), np.eye(2)
    Q, amp = np.eye(2) * q, np.zeros(n)
    for k in range(n):
        P = P + Q  # predict (random walk)
        H = np.array([np.cos(w0 * k), np.sin(w0 * k)])
        y_pred = H @ xk
        S = H @ P @ H.T + r
        K = (P @ H) / S
        xk = xk + K * (x[k] - y_pred)
        P = P - np.outer(K, H @ P)
        amp[k] = np.sqrt(xk[0] ** 2 + xk[1] ** 2)
    return amp

# grid-search Q (tradeoff between transient tracking and steady-state noise rejection)
r_meas = noise_sigma ** 2 + 0.5 * 0.5 ** 2  # approximate the interferer's contribution as observation noise
best_q = min([1e-6, 1e-5, 3e-5, 1e-4, 3e-4, 1e-3, 1e-2],
             key=lambda q: np.sqrt(np.mean((run_kalman(x, w0, q, r_meas)[100:] - A_true[100:]) ** 2)))
amp_kalman = run_kalman(x, w0, best_q, r_meas)
The grid search found \(Q=3\times10^{-4}\) gives the minimum RMSE.
Method 3: Wavelet CWT (complex Morlet, batch, non-causal)
The measured code in https://yuhi-sa.github.io/en/posts/20260226_wavelet/1/ and https://yuhi-sa.github.io/en/posts/20260524_time_frequency_guide/1/ used the real-valued "morl" wavelet, which is fine for ridge-tracking an instantaneous frequency but poorly suited to extracting an amplitude envelope, since convolution with a real wavelet still oscillates at the carrier frequency. Following the same idea as the analytic signal in the https://yuhi-sa.github.io/en/posts/20260318_hilbert_transform/1/ article, we use the complex Morlet "cmor1.5-1.0" and take the magnitude of the coefficients as the envelope.
wavelet_name = "cmor1.5-1.0"
scale_f0 = pywt.frequency2scale(wavelet_name, f0 / fs)
coef, freqs_cwt = pywt.cwt(x, [scale_f0], wavelet_name, sampling_period=1 / fs)
amp_cwt_raw = np.abs(coef[0])

# CWT coefficient magnitude isn't in physical amplitude units, so calibrate against
# a steady-state window (t=3.0-3.8s, true value 1.0). 3.8-4.0s is excluded because
# it falls inside the cone-of-influence (edge effect).
calib_mask = (t >= 3.0) & (t <= 3.8)
calib_factor = 1.0 / np.mean(amp_cwt_raw[calib_mask])
amp_cwt = amp_cwt_raw * calib_factor
Output:
CWT scale for 50.0Hz: 20.000, calibration factor: 0.4551
Results: accuracy, robustness, computational cost
Excluding the last 0.15s (CWT’s cone-of-influence region) and the first 0.1s (FFT’s warm-up window) from all three methods equally, we measured RMSE, steady-state standard deviation, detection latency (time between the true step at \(t=2.0\) s and the first crossing of a 0.65 threshold), and execution time (averaged over 5 runs).
| Method | RMSE | Steady std (pre-step) | Steady std (post-step) | Detection latency | Exec time (5-run avg) |
|---|---|---|---|---|---|
| FFT (sliding window) | 0.090 | 0.070 | 0.044 | +58ms | 5.83ms |
| Kalman (IQ tracking) | 0.088 | 0.073 | 0.054 | +28ms | 26.94ms |
| Wavelet CWT (cplx Morlet) | 0.076 | 0.079 | 0.061 | +5ms | 0.70ms |
All three land around RMSE 0.08, but detection latency and execution time differ substantially. CWT detects the change within 5ms of the true step — but that’s because it processes the whole signal at once (non-causal, batch). Convolving with a symmetric wavelet lets it use information from both before and after the change point, so detection looks almost instantaneous. Kalman and FFT, by contrast, are causal estimators that only use observations up to time \(k\)
, so they cannot avoid some detection lag in principle. CWT’s execution time is also the fastest, partly because pywt.cwt’s single-scale convolution is vectorized internally, while the FFT and Kalman implementations above still use a Python loop (a production system would vectorize the FFT-based convolution too).
The figure below overlays all three methods’ estimates on the same signal.
Robustness across noise levels: the ranking flips
Repeating the same experiment at noise standard deviations \(\sigma =\) 0.2/0.4/0.8/1.2 produces an interesting result: the best method flips between the low-noise and high-noise regimes.
| \(\sigma\) | FFT | Kalman | Wavelet CWT |
|---|---|---|---|
| 0.2 | 0.073 | 0.067 | 0.043 |
| 0.4 | 0.090 | 0.088 | 0.076 |
| 0.8 | 0.132 | 0.126 | 0.141 |
| 1.2 | 0.176 | 0.157 | 0.203 |
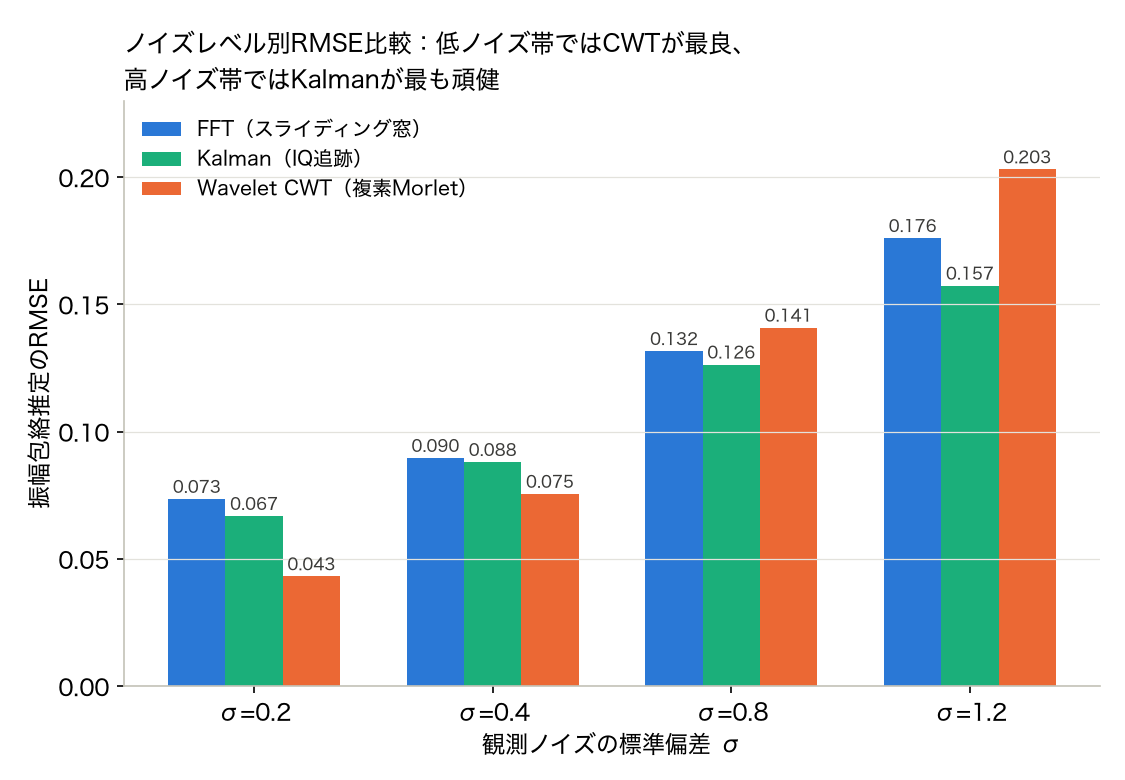
At low noise (\(\sigma \le 0.4\) ), CWT is the most accurate. At high noise (\(\sigma \ge 0.8\) ), the Kalman filter becomes the most robust, and CWT drops to last place. This happens because CWT’s calibration factor is fixed (a single-point calibration against a steady-state window), whereas the Kalman filter is an optimal estimator that explicitly adjusts its gain to the noise level through the observation noise covariance \(R\) . In settings where the noise level is unknown or drifts over time, Kalman’s adaptivity pays off.
Kalman process noise \(Q\) sensitivity: responsiveness vs. noise rejection, measured
The Kalman filter’s process noise \(Q\) directly controls the tradeoff between “how fast it tracks an amplitude step” and “how much it ignores steady-state noise.” Measured:
| \(Q\) setting | RMSE | Detection latency |
|---|---|---|
| Too small (\(10^{-6}\) ) | 0.224 | +527ms |
| Best (\(3\times10^{-4}\) ) | 0.088 | +28ms |
| Too large (\(10^{-2}\) ) | 0.178 | negative (false alarm) |
With \(Q\) too small, the state is nearly frozen and takes 527ms to catch up to the step. With \(Q\) too large, the filter becomes overly sensitive to noise and crosses the threshold before the true change point at \(t=2.0\) s (an apparent “negative latency”). Unlike CWT’s genuine non-causal early detection, this is a false alarm caused by noise — Kalman is a causal method and cannot use future information, so a negative latency here always means “detected too early,” never “correctly detected early.” In this regime the threshold is crossed by noise alone well before the real change, so the exact timing of the “first crossing” (the magnitude of the negative latency) is sensitive to how that first-crossing event is defined and can vary considerably by implementation detail — what matters here is the sign (too early, not too late) and that it is a false alarm, not the precise magnitude. When tuning \(Q\) in practice, grid-searching for RMSE alone is not enough; you must also check whether threshold crossings cluster near the true change point (i.e., the false-alarm rate).
Decision framework, grounded in the measurements above
- Batch processing is acceptable and the noise level is low-to-moderate and known → Wavelet (complex Morlet). Once calibrated, it gives both the best accuracy and the fastest execution time — but watch the cone-of-influence at signal boundaries.
- Real-time, low-latency is a hard requirement (causal, sequential processing needed) → Kalman filter. Lower latency than FFT in this experiment (28ms vs. 58ms), and adapts better to a changing noise level.
- Noise level is high, or unknown and drifting → Kalman filter. Its optimal gain adjustment through the observation covariance \(R\) is more robust than CWT’s fixed calibration.
- Simplicity of implementation and ease of validation matter most → FFT (sliding window). Its only parameter is window length \(L\) , and the frequency resolution \(f_s/L\) makes it easy to reason about — but it tends to have the largest detection latency of the three.
- Both real-time behavior and noise robustness are needed → Kalman is the middle ground here, but a mistuned \(Q\) swings between “too slow” and “too many false alarms.” Always pair the grid search above with a false-alarm-rate check.
Recent development: reinforcing Kalman’s frequency selectivity with neural networks
The weakness this experiment exposed in the Kalman filter is that it lumps all frequency-domain noise structure (here, the 120 Hz interferer) into a single observation noise term \(R\) . Dogan, Demirel, and Holz’s FW-NKF (Frequency-Weighted Neural Kalman Filters) tackles this limitation directly: it embeds a causal spectral-shaping operator into the Kalman innovation (observation residual) and learns the observation and transition models with neural networks, explicitly suppressing frequency-dependent disturbances such as vibration or band-limited noise (Dogan, Demirel, Holz, FW-NKF: Frequency-Weighted Neural Kalman Filters, ICRA 2026, https://arxiv.org/abs/2606.02251 ). It replaces exactly the simplification we saw here — folding the interferer into \(R\) — with a learned spectral operator, and is a good example of the current trend toward combining classical state estimation with the representational power of neural networks.
7. Learning Checklist (40 items)
Math basics
- Physical meaning of \(e^{j\omega t}\)
- Relation between Laplace and Fourier transforms
- Transfer function of an LTI system
- Parseval’s identity
- Nyquist theorem
Bode / Filter design
- Define cutoff at \(-3\) dB
- Compare Butterworth and Chebyshev passband/stopband
- Why Bessel has flat group delay
- Chain
scipy.signal.butter→lfilter - IIR vs FIR stability and linear phase
- Notch \(Q\) vs bandwidth
- Role of bilinear z-transform
Fourier / Time-frequency
- Output length and frequency axis of
numpy.fft.fft - Window functions vs spectral leakage
- Units of PSD (V²/Hz)
- Choose STFT frame and hop length
- CWT vs DWT
- Why Wavelet Packet has higher resolution than CWT
- Hilbert transform and analytic signal
- Mode mixing in EMD vs VMD
- Choose \(L\) in SSA from period
ML time-series
- K-means K selection (elbow / silhouette)
- EM updates for GMM
- RandomForest vs GBDT
- LSTM gates (input/forget/output)
- IsolationForest scoring
- Avoid leakage in time-series train/val/test split
- Kalman filter prediction / update
- EKF vs UKF Jacobian-free advantage
Stochastic optimization
- CEM elite rate
- SA temperature schedule
- GA crossover / mutation
- MPPI as weighted CEM
- BO acquisition functions (EI / PI / UCB)
Integration
- Sensor → filter → feature → classifier pipeline
- STFT features → IsolationForest
- SSA trend removal then LSTM
- Hyperparameter BO implementation
- Multi-subplot visualization with matplotlib
- Reproducibility with
numpy.random.seed
8. Common Stumbling Blocks Q&A
Q1. FFT frequency axis is confusing. Use np.fft.fftfreq(N, d=1/fs) or np.fft.rfftfreq.
Q2. The filter rings. scipy.signal.butter expects normalized frequency relative to fs/2; pass Wn=cutoff/(fs/2) or use fs=fs kwarg.
Q3. LSTM does not learn. Most often due to missing scaling — apply StandardScaler first.
Q4. Cannot pick STFT window length. Aim for 5–10 periods of the target frequency: nperseg = int(5 / target_freq * fs).
Q5. EMD or VMD? VMD when mode count is known; EMD (EEMD) for adaptive exploration. See https://yuhi-sa.github.io/en/posts/20260528_mode_decomposition/1/.
Q6. Anomaly detection has false positives. Use Hilbert envelope, Wavelet energy, or STFT band averages so features reflect locality. Tune contamination of IsolationForest.
Q7. BO budget runs out. Switch acquisition from EI to UCB after 50 trials with no progress.
9. Related Articles
Five hubs:
- https://yuhi-sa.github.io/en/posts/20260521_bode_plot/1/
- https://yuhi-sa.github.io/en/posts/20260522_monte_carlo_optimization/1/
- https://yuhi-sa.github.io/en/posts/20260522_filter_design_guide/1/
- https://yuhi-sa.github.io/en/posts/20260524_time_frequency_guide/1/
- https://yuhi-sa.github.io/en/posts/20260525_ml_timeseries_guide/1/
Component articles:
- https://yuhi-sa.github.io/en/posts/20260225_fft/1/ / https://yuhi-sa.github.io/en/posts/20260228_fft_window_psd/1/ / https://yuhi-sa.github.io/en/posts/20260429_stft/1/
- https://yuhi-sa.github.io/en/posts/20260226_wavelet/1/ / https://yuhi-sa.github.io/en/posts/20260522_wavelet_packet/1/ / https://yuhi-sa.github.io/en/posts/20260318_hilbert_transform/1/ / https://yuhi-sa.github.io/en/posts/20260528_mode_decomposition/1/
- https://yuhi-sa.github.io/en/posts/20260226_butterworth/1/ / https://yuhi-sa.github.io/en/posts/20260314_chebyshev_filter/1/ / https://yuhi-sa.github.io/en/posts/20260316_bessel_filter/1/ / https://yuhi-sa.github.io/en/posts/20260226_fir_iir/1/
- https://yuhi-sa.github.io/en/posts/20260228_notch_filter/1/ / https://yuhi-sa.github.io/en/posts/20260312_bandpass_filter/1/ / https://yuhi-sa.github.io/en/posts/20260313_highpass_filter/1/ / https://yuhi-sa.github.io/en/posts/20260223_lowpass_filter/1/
- https://yuhi-sa.github.io/en/posts/20260224_kalman_filter/1/ / https://yuhi-sa.github.io/en/posts/20260224_ekf/1/ / https://yuhi-sa.github.io/en/posts/20260226_ukf/1/ / https://yuhi-sa.github.io/en/posts/20260223_particle_filter/1/ / https://yuhi-sa.github.io/en/posts/20260223_rts_smoother/1/
- https://yuhi-sa.github.io/en/posts/20260226_kmeans_gmm/1/ / https://yuhi-sa.github.io/en/posts/20260226_ensemble_learning/1/ / https://yuhi-sa.github.io/en/posts/20260317_lstm_timeseries/1/ / https://yuhi-sa.github.io/en/posts/20260228_timeseries_anomaly/1/
- https://yuhi-sa.github.io/en/posts/20260223_bayesian_optimization/1/ / https://yuhi-sa.github.io/en/posts/20210329_cem/1/ / https://yuhi-sa.github.io/en/posts/20260226_simulated_annealing/1/ / https://yuhi-sa.github.io/en/posts/20260226_genetic_algorithm/1/ / https://yuhi-sa.github.io/en/posts/20260215_mppi/1/
New hubs added in recent rounds (five-hub → eight-hub expansion)
Earlier rounds added a discrete-DSP foundations hub and a mode-decomposition hub; this round (R10) adds a cryptography hub, extending the roadmap to an eight-hub layout.
- https://yuhi-sa.github.io/en/posts/20260613_discrete_dsp_basics/1/ — Discrete DSP foundations hub (sampling theorem / DTFT, DFT, FFT / Z-transform / autocorrelation / DCT). The official entry point to the “DSP basics” layer of this roadmap.
- https://yuhi-sa.github.io/en/posts/20260528_mode_decomposition/1/ — Mode decomposition hub (EMD / VMD / SSA). Non-stationary preprocessing that feeds into the ML time-series hub.
- https://yuhi-sa.github.io/en/posts/20260614_cryptography_roadmap/1/ — Cryptography roadmap hub (symmetric / public-key / hash / key exchange). An orthogonal security axis, but binary exponentiation and discrete math connect cleanly to DSP integer algorithms.
In addition, a fifth pillar has been added to the ML time-series hub:
- https://yuhi-sa.github.io/en/posts/20260614_transformer_timeseries/1/ — Transformer for time-series forecasting. Overcomes LSTM’s long-range limits with self-attention and organizes the Informer / Autoformer / TimesNet family. The natural next step after LSTM in the “ML time-series” layer of this roadmap.