Why Mode Decomposition? Limits of Fourier and Wavelet
The Fourier transform assumes a superposition of stationary sinusoids and struggles with non-stationary signals whose frequency changes momentarily, or non-linear signals whose amplitude and frequency vary simultaneously. Short-Time Fourier Transform (STFT) and Wavelet analysis improve time-frequency localization, but they fix the basis (window or mother wavelet) up front, limiting accuracy when the basis does not match the data.
Mode decomposition extracts Intrinsic Mode Functions (IMFs) in a data-driven way from the signal itself. The three established methods are:
- EMD (Empirical Mode Decomposition) — Huang (1998); removes local means iteratively via the sifting algorithm.
- VMD (Variational Mode Decomposition) — Dragomiretskiy (2014); solves a constrained variational problem with ADMM.
- SSA (Singular Spectrum Analysis) — separates periodic and trend components via SVD of the trajectory matrix.
All three handle non-stationary, non-linear signals well, and combined with the Hilbert transform (https://yuhi-sa.github.io/en/posts/20260318_hilbert_transform/1/) form the Hilbert-Huang Transform (HHT) for instantaneous amplitude and frequency.
1. EMD: Empirical Mode Decomposition
1.1 IMF Conditions
An IMF must satisfy:
- The number of extrema and the number of zero crossings differ by at most one.
- The mean of the upper and lower envelopes (cubic-spline interpolation of maxima and minima) is zero at every point.
Locally this represents an “amplitude-modulated single-frequency component”.
1.2 The Sifting Algorithm
From \(x(t)\) , iterate
\[ h_0(t) = x(t), \quad h_{k+1}(t) = h_k(t) - m_k(t) \]where \(m_k(t)\) is the mean of the upper and lower envelopes of \(h_k\) . Stop when a Cauchy SD criterion (typically 0.2–0.3) is satisfied, set \(\mathrm{IMF}_1 = h_K\) , and recurse on the residual \(r_1 = x - \mathrm{IMF}_1\) .
1.2.1 Why “subtracting the local mean” pushes a signal toward the IMF condition
What sifting actually accomplishes can be read directly off the interpolation property of the envelopes. The upper envelope \(e_{\mathrm{up}}(t)\) is constructed by interpolating the maxima \(\{(\tau_i, M_i)\}\) of \(h_k(t)\) , so by construction
\[ e_{\mathrm{up}}(\tau_i) = M_i = h_k(\tau_i) \]holds exactly at every maximum \(\tau_i\) (and symmetrically for the lower envelope \(e_{\mathrm{low}}\) at minima). Evaluating the local mean \(m_k(t) = \bigl(e_{\mathrm{up}}(t) + e_{\mathrm{low}}(t)\bigr)/2\) at a maximum \(\tau_i\) therefore gives
\[ m_k(\tau_i) = \frac{h_k(\tau_i) + e_{\mathrm{low}}(\tau_i)}{2} \]so the value at the same time in the next iteration can be rewritten as
\[ h_{k+1}(\tau_i) = h_k(\tau_i) - m_k(\tau_i) = \frac{h_k(\tau_i) - e_{\mathrm{low}}(\tau_i)}{2} \]In other words, sifting pulls each maximum back by exactly half of how asymmetrically it overshoots the paired lower envelope at that instant. When a signal has oscillations “riding” on top of a slowly varying trend, the upper maxima sit systematically too high relative to the lower envelope, so this operation systematically lowers the maxima (and, symmetrically, raises the minima) — shrinking the asymmetry between the two envelopes (equivalently, how far the local mean deviates from zero) with each iteration.
This is not a proof of monotone convergence to IMF condition 2 (envelope mean is zero everywhere) — the general convergence of sifting was only demonstrated numerically in Huang et al.’s original 1998 paper, and a rigorous convergence theorem for arbitrary signals remains an open problem to this day (explicitly discussed in Rilling, Flandrin, Gonçalves, “On Empirical Mode Decomposition and its Algorithms”, NSIP-03, 2003). In practice, the fact that each iteration reduces local asymmetry is used only as a constructive, empirical justification that finitely many iterations reach a sufficiently small residual — this nuance is worth stating precisely rather than glossing over.
1.3 The mathematics of the stopping criterion
If sifting is iterated indefinitely, the result typically approaches a “nearly constant-amplitude, pure frequency-modulated” signal that has lost its amplitude-modulation information, which defeats the purpose of later extracting amplitude via the Hilbert transform. A criterion for cutting off the iteration at an appropriate point is therefore needed.
1.3.1 Huang’s SD (standard-deviation) criterion
The criterion proposed by Huang et al. (1998) computes the energy-normalized difference between two consecutive sifting results,
\[ SD_k = \sum_{t} \frac{\bigl(h_{k-1}(t) - h_k(t)\bigr)^2}{h_{k-1}(t)^2} \]and stops once \(SD_k\) falls below a threshold (typically \(0.2\) –\(0.3\) ). This is a discretized, energy-normalized version of the Cauchy convergence test. \(SD_k \to 0\) signals that further sifting barely changes \(h\) , but as noted above, sifting itself carries no general convergence guarantee, so \(SD_k\) is a practical heuristic rather than a quantity theoretically guaranteed to vanish.
1.3.2 The S-number criterion (Rilling et al. 2003)
The SD criterion has a practical weakness: its denominator \(h_{k-1}(t)^2\) can become numerically unstable (near division by zero) on intervals where the signal is locally small. Rilling, Flandrin, and Gonçalves (2003) proposed instead the S-number criterion, which stops once IMF condition 1 (the number of extrema and zero-crossings differ by at most one) has held for \(S\) consecutive iterations (\(S\) is typically 3–8). Huang himself proposed a closely related criterion in a separate 1999 paper; the S-number criterion is now a widely used practical standard that compensates for the SD criterion’s numerical fragility.
1.3.3 Over-sifting and under-sifting as edge cases
How the stopping criterion is set produces two distinct failure modes:
- Under-sifting: If the threshold is set too loose (a large tolerance on \(SD\) , or an artificially small iteration budget), sifting stops after only one or a few iterations, and the resulting “proto-IMF” is passed downstream without satisfying IMF condition 1 (extrema count ≈ zero-crossing count). Multiple frequency components then remain mixed together in a single mode instead of being separated into the residual, aggravating mode mixing (Section 1.6).
- Over-sifting: If the threshold is set too strict (excessive iterations), computational cost grows, and more importantly the amplitude-modulation content is smoothed away toward a “near-constant-amplitude” signal that has lost physically meaningful amplitude fluctuations. The IMF condition itself becomes easier to satisfy, but the physical interpretability of the resulting IMF (e.g., the impulse amplitude fluctuations used in bearing diagnostics) can be degraded.
1.4 Experimental verification: varying the stopping threshold
To verify this in practice, we implement the sifting loop manually (cubic-spline envelopes, SD-based stopping) and sweep the SD threshold from \(10^{-4}\) to \(0.5\) , measuring (i) the number of iterations to converge and (ii) the resulting proto-IMF’s “|# extrema − # zero-crossings|” (how well IMF condition 1 is satisfied). The test signal is the same chirp + AM + noise signal used below:
import numpy as np
from scipy.interpolate import CubicSpline

def envelope_mean(h, t):
    imax = (np.diff(np.sign(np.diff(h))) < 0).nonzero()[0] + 1
    imin = (np.diff(np.sign(np.diff(h))) > 0).nonzero()[0] + 1
    if len(imax) < 2 or len(imin) < 2:
        return None, None, None
    cs_max = CubicSpline(t[imax], h[imax])
    cs_min = CubicSpline(t[imin], h[imin])
    return (cs_max(t) + cs_min(t)) / 2, len(imax), len(imin)

def sift_to_convergence(x, t, sd_thr, max_iter=200):
    h = x.copy()
    for k in range(max_iter):
        mean_env, nmax, nmin = envelope_mean(h, t)
        if mean_env is None:
            break
        h_new = h - mean_env
        sd = np.sum((h - h_new) ** 2) / np.sum(h ** 2 + 1e-300)
        h = h_new
        if sd < sd_thr:
            break
    _, nmax_f, nmin_f = envelope_mean(h, t)
    n_extrema = (nmax_f or 0) + (nmin_f or 0)
    n_zc = int(np.sum(np.diff(np.sign(h)) != 0))
    return k + 1, n_extrema, n_zc

fs = 1000
t = np.arange(0, 2, 1 / fs)
np.random.seed(0)
x = (
    np.sin(2 * np.pi * (5 + 10 * t) * t)
    + (1 + 0.5 * np.sin(2 * np.pi * 1.0 * t)) * np.sin(2 * np.pi * 60 * t)
    + 0.1 * np.random.randn(len(t))
)

for sd_thr in [1e-4, 1e-3, 1e-2, 0.05, 0.2, 0.5]:
    n_iter, n_ext, n_zc = sift_to_convergence(x, t, sd_thr)
    print(f"SD_thr={sd_thr:8.4f}  iters={n_iter:3d}  extrema={n_ext:5d}  zero_cross={n_zc:5d}  |diff|={abs(n_ext-n_zc):4d}")
Results:
| SD threshold | Iterations | # extrema | # zero-crossings | |# extrema − # zero-crossings| |
|---|---|---|---|---|
| 0.0001 | 33 | 1327 | 1328 | 1 |
| 0.001 | 17 | 1211 | 1212 | 1 |
| 0.01 | 11 | 1143 | 1130 | 13 |
| 0.05 | 7 | 1065 | 1027 | 38 |
| 0.2 | 6 | 1019 | 973 | 46 |
| 0.5 | 1 | 660 | 502 | 158 |
Loosening the threshold to \(0.5\) stops sifting after a single iteration, and the extrema/zero-crossing gap widens to 158 — a large departure from IMF condition 1 (gap ≤ 1), meaning the resulting “IMF” is really an undecomposed signal still containing multiple scales (under-sifting). Tightening the threshold to \(10^{-3}\) or below drives the gap to essentially 1, but the iteration count grows to 17–33: going from threshold \(0.01\) (gap 13) to \(0.001\) (gap 1) requires 1.5× more iterations (11 → 17). Satisfying the IMF condition improves monotonically as the SD threshold tightens, but there is a clear trade-off against computational cost.
1.5 EMD in Python with PyEMD
import numpy as np
import matplotlib.pyplot as plt
from PyEMD import EMD

fs = 1000
t = np.arange(0, 2, 1 / fs)
np.random.seed(0)
x = (
    np.sin(2 * np.pi * (5 + 10 * t) * t)
    + (1 + 0.5 * np.sin(2 * np.pi * 1.0 * t)) * np.sin(2 * np.pi * 60 * t)
    + 0.1 * np.random.randn(len(t))
)

emd = EMD()
imfs = emd(x)
print(f"Number of IMFs: {len(imfs)}")
Running the code above extracted 8 IMFs.
1.6 The mathematical origin of mode mixing
EMD suffers from mode mixing: (a) similar frequencies scattered across several IMFs, or (b) widely different frequencies/scales sharing a single IMF. We leave the EEMD/CEEMDAN remedies to https://yuhi-sa.github.io/en/posts/20260714_ceemdan_hht/1/; here we explain why mode mixing happens, from the structure of the sifting algorithm itself.
Sifting is a purely time-local operation: at every iteration, its only information source is “the envelope obtained by spline-interpolating the local extrema of \(h_k(t)\) .” As shown in Section 1.2.1, the envelopes interpolate exactly through the extrema, so the extracted value at any instant is determined solely by which extrema exist nearby in time — it never references global frequency information the way a Fourier transform would. This locality is the direct cause of mode mixing in two situations:
- Close frequencies: superposing two components with nearby angular frequencies \(\omega_1, \omega_2\) , i.e. \(A_1 \sin(\omega_1 t) + A_2 \sin(\omega_2 t)\) , produces a beat pattern — a carrier at angular frequency \((\omega_1+\omega_2)/2\) amplitude-modulated at the beat frequency \(|\omega_1-\omega_2|/2\) . The smaller \(|\omega_1-\omega_2|\) is, the longer this beat period becomes, and the local spacing of maxima/minima (≈ the reciprocal of the instantaneous frequency) drifts slowly on the timescale of the beat. Because sifting only looks at individual extrema, it has no global basis for telling \(\omega_1\) and \(\omega_2\) apart as distinct “oscillatory modes,” and instead extracts the entire beat as a single amplitude-modulated oscillation. The information from the two pure tones then leaks across one or two IMFs.
- Intermittency: consider a low-frequency continuous wave with a high-frequency burst superposed only over a short interval. During the burst, the local density of extrema jumps sharply, so the “scale” of the proto-IMF extracted over that interval spikes over a short time. Sifting picks up this short burst of high-density extrema to build one IMF, but once the burst ends, that same IMF starts picking up the sparser extrema of the low-frequency background instead. A single IMF ends up containing both “the high-frequency scale during the burst” and “the low-frequency scale outside it” — this discontinuous mixing of scales is the classic form of intermittency-induced mode mixing (a canonical example reported in Huang et al., 2005).
1.7 Experimental verification of mode mixing
We reproduce both situations with actual signals.
import numpy as np
from PyEMD import EMD

fs = 1000
t = np.arange(0, 2, 1 / fs)

def power_at(signal, fs, f_target):
    spec = np.abs(np.fft.rfft(signal))
    freqs = np.fft.rfftfreq(len(signal), 1 / fs)
    idx = np.argmin(np.abs(freqs - f_target))
    return spec[idx]

# (a) Close frequencies: 20Hz + 24Hz (ratio 24/20 = 1.2)
np.random.seed(1)
x_close = np.sin(2 * np.pi * 20 * t) + 0.7 * np.sin(2 * np.pi * 24 * t) + 0.05 * np.random.randn(len(t))
imfs_close = EMD()(x_close)

# (a-reference) Well-separated frequencies: 20Hz + 60Hz (ratio 3.0)
np.random.seed(1)
x_sep = np.sin(2 * np.pi * 20 * t) + 0.7 * np.sin(2 * np.pi * 60 * t) + 0.05 * np.random.randn(len(t))
imfs_sep = EMD()(x_sep)

for i in [1, 2]:  # IMF2, IMF3
    p20c, p24c = power_at(imfs_close[i], fs, 20), power_at(imfs_close[i], fs, 24)
    p20s, p60s = power_at(imfs_sep[i], fs, 20), power_at(imfs_sep[i], fs, 60)
    print(f"IMF{i+1}: [close 20/24Hz] 20Hz={p20c:.1f} 24Hz={p24c:.1f}  |  [separated 20/60Hz] 20Hz={p20s:.1f} 60Hz={p60s:.1f}")

# (b) Intermittent burst: 5Hz continuous wave + 50Hz burst only from 0.8-1.0s
np.random.seed(2)
x_inter = np.sin(2 * np.pi * 5 * t) + 0.05 * np.random.randn(len(t))
burst_mask = (t >= 0.8) & (t < 1.0)
x_inter[burst_mask] += 1.5 * np.sin(2 * np.pi * 50 * t[burst_mask])
imfs_inter = EMD()(x_inter)
for i in range(3):
    e_in = np.sum(imfs_inter[i][burst_mask] ** 2)
    e_out = np.sum(imfs_inter[i][~burst_mask] ** 2)
    print(f"IMF{i+1}: fraction of energy inside the burst window (10% of duration)={e_in/(e_in+e_out)*100:.1f}%")
Results (close vs. separated frequencies, FFT amplitude):
| IMF | Close (20/24Hz) power @ 20Hz | Close power @ 24Hz | Separated (20/60Hz) power @ 20Hz | Separated power @ 60Hz |
|---|---|---|---|---|
| IMF2 | 276.4 | 207.5 | 23.0 | 662.3 |
| IMF3 | 717.2 | 494.2 | 978.0 | 4.4 |
For close frequencies (20Hz and 24Hz, ratio 1.2), both IMF2 and IMF3 contain 20Hz and 24Hz content at comparable strength — sifting extracts the beat as a single unit and fails to separate the two pure tones into distinct IMFs. For well-separated frequencies (20Hz and 60Hz, ratio 3.0), IMF2 is dominated by 60Hz (20Hz leakage is only ~3.5% of the 60Hz power) and IMF3 is dominated by 20Hz (60Hz leakage only ~0.4%) — a clean separation.
Results (intermittent burst; the burst window is 10% of the total duration):
| IMF | Fraction of energy inside the burst window |
|---|---|
| IMF1 | 98.6% |
| IMF2 | 98.4% |
| IMF3 | 88.6% |
Although the 50Hz burst exists for only 10% of the total time, high-energy content localized at that window appears across three IMFs — IMF1, IMF2, and IMF3. If the burst were cleanly isolated as a single scale, its energy would concentrate in one IMF; instead, the abrupt change in extrema density at burst onset/offset propagates across multiple proto-IMFs, so several IMFs with different frequency content end up coexisting over the same time window — the textbook signature of intermittency-induced mode mixing (mode splitting).
EEMD (Ensemble EMD) mitigates this mixing by averaging many trials with added white noise. The algorithmic details of EEMD/CEEMDAN, together with a quantitative comparison that includes mode splitting, are covered in https://yuhi-sa.github.io/en/posts/20260714_ceemdan_hht/1/.
2. VMD: Variational Mode Decomposition
2.1 Constrained Variational Problem
VMD decomposes \(x(t)\) into \(K\) AM-FM modes \(u_k(t)\) designed so each mode has tight bandwidth around a center frequency \(\omega_k\) :
\[ \min_{\{u_k\},\{\omega_k\}} \sum_{k=1}^K \left\| \partial_t \left[ \left( \delta(t) + \frac{j}{\pi t} \right) * u_k(t) \right] e^{-j \omega_k t} \right\|_2^2 \]subject to \(\sum_k u_k(t) = x(t)\) .
2.2 ADMM Solution
Form the augmented Lagrangian and iterate via the Alternating Direction Method of Multipliers:
- Update \(u_k\) as a Wiener-like filter in the frequency domain.
- Update \(\omega_k\) as the centroid of \(|u_k|^2\) .
- Dual ascent on the multiplier \(\lambda\) .
You must pre-specify \(K\) and the bandwidth penalty \(\alpha\) ; EMD is adaptive.
2.3 VMD in Python with vmdpy
from vmdpy import VMD

K = 4
alpha = 2000
tau = 0.0
DC = False
init = 1
tol = 1e-7

u, u_hat, omega = VMD(x, alpha, tau, K, DC, init, tol)
print(f"VMD center frequencies (Hz): {omega[-1] * fs}")
VMD suppresses EMD’s mode mixing and gives stable frequency separation. Choosing \(K\) via the elbow of energy contribution is common.
3. SSA: Singular Spectrum Analysis
3.1 Constructing the Trajectory Matrix
From a length-\(N\) signal \(x(1), \ldots, x(N)\) , build the trajectory matrix (a Hankel matrix) with window length \(L\) (\(1 < L < N\) ). Setting \(K = N - L + 1\) , form the \(L\) -dimensional lag vectors
\[ X_j = \bigl(x(j), x(j+1), \ldots, x(j+L-1)\bigr)^\top, \quad j = 1, \ldots, K \]and stack them as columns to obtain
\[ X = \begin{pmatrix} x_1 & x_2 & \cdots & x_{K} \\ x_2 & x_3 & \cdots & x_{K+1} \\ \vdots & & & \vdots \\ x_L & x_{L+1} & \cdots & x_N \end{pmatrix} \in \mathbb{R}^{L \times K} \]Every anti-diagonal of \(X\) (the set of entries with constant \(i+j\) ) equals the same original sample \(x(i+j-1)\) — this constant-anti-diagonal structure is exactly why \(X\) is called a Hankel matrix. \(L\) controls how much of a given scale fits inside one delay window; to detect a component of period \(T\) , a common rule of thumb is \(L \gtrsim T\) (if \(L\) is too short, a full cycle of that period never fits inside the window and cannot be detected).
3.2 SVD and the Decomposition into Eigentriples
\(X^\top X \in \mathbb{R}^{K \times K}\) is symmetric positive semi-definite, so it has eigenvalues \(\lambda_1 \geq \lambda_2 \geq \cdots \geq \lambda_d \geq 0\) (where \(d = \mathrm{rank}(X) \leq \min(L,K)\) ) with orthonormal eigenvectors \(V_1, \ldots, V_d\) . Setting \(\sigma_i = \sqrt{\lambda_i}\) and \(U_i = X V_i / \sigma_i\) (for \(\sigma_i > 0\) ) makes \(\{U_i\}\) orthonormal as well, and yields the singular value decomposition
\[ X = \sum_{i=1}^{d} \sigma_i U_i V_i^\top = \sum_{i=1}^{d} X_i, \qquad X_i \equiv \sigma_i U_i V_i^\top \]Each triple \((\sigma_i, U_i, V_i)\) is called an eigentriple, and each rank-1 matrix \(X_i\) (\(L \times K\) ) is an elementary matrix. That this decomposition reconstructs the original trajectory matrix exactly — not approximately — follows as an identity from the completeness of the SVD (that \(U\) and \(V\) span orthonormal bases). Moreover, by the Eckart–Young theorem, the sum of the top \(r\) elementary matrices, \(\sum_{i=1}^r X_i\) , minimizes the Frobenius-norm error \(\|X - \sum_{i=1}^r X_i\|_F\) among all matrices of rank at most \(r\) — so SSA’s basic strategy of “keeping only the leading few singular values” is justified precisely as a consequence of this optimality.
3.3 Grouping and Diagonal Averaging (Hankelization)
An elementary matrix \(X_i\) generally does not have the constant-anti-diagonal (Hankel) structure. For a chosen index subset \(I\) (e.g. “an adjacent pair” or “the single largest singular value”), form the grouped matrix \(X_I = \sum_{i \in I} X_i\) , and average all entries \((p,q)\) of \(X_I\) with a fixed \(p+q\) — this is diagonal averaging:
\[ \hat{x}(k) = \frac{1}{\left| \{(p,q) : p+q=k+1,\ 1\le p\le L,\ 1\le q\le K\} \right|} \sum_{\substack{(p,q):\, p+q=k+1 \\ 1 \le p \le L,\ 1 \le q \le K}} X_I(p,q) \]which recovers a one-dimensional series \(\hat{x}(1), \ldots, \hat{x}(N)\) . Partitioning all indices \(\{1,\ldots,d\}\) into disjoint groups \(I_1, \ldots, I_m\) whose union is everything, diagonally averaging each group and summing recovers the original signal \(x\) exactly, because diagonal averaging is a linear operation (verified numerically in Section 3.5).
Why this grouping corresponds to meaningful “trend,” “periodic,” and “noise” components rests on the fact that a periodic component’s trajectory matrix theoretically appears as an adjacent pair of nearly equal singular values. The trajectory matrix of a sinusoid \(A\sin(\omega n + \phi)\) with amplitude \(A\) and angular frequency \(\omega\) spans a rank-2 subspace covering the \(\sin\) and \(\cos\) (90°-shifted) directions, so its eigentriples theoretically appear as a pair with nearly equal singular values. A non-oscillatory component like a trend, by contrast, often shows up as one or several unpaired (single) eigentriples within a finite window, while white noise forms a “flat noise floor” of many small singular values with (theoretically) equal expectation. The condition under which two additive components separate cleanly (weak separability) is that their trajectory subspaces be nearly orthogonal — separability degrades for two periodic components with close frequencies, or for a trend alongside a long-period component (structurally the same limitation as EMD’s mixing of close frequencies).
3.4 SSA in Python (numpy only)
def ssa_decompose(x, L=100, n_components=4):
    N = len(x)
    K = N - L + 1
    X = np.array([x[i:i + L] for i in range(K)]).T
    U, s, Vt = np.linalg.svd(X, full_matrices=False)
    components = []
    for i in range(n_components):
        Xi = s[i] * np.outer(U[:, i], Vt[i, :])
        recon = np.zeros(N)
        counts = np.zeros(N)
        for ii in range(L):
            for jj in range(K):
                recon[ii + jj] += Xi[ii, jj]
                counts[ii + jj] += 1
        components.append(recon / counts)
    return np.array(components), s

modes, sigmas = ssa_decompose(x, L=200, n_components=4)
SSA has only two parameters (\(L\) and the number of components), is numerically stable thanks to linear algebra, and is often more robust than EMD/VMD on short or noisy series.
3.5 Experimental verification: singular-value decay and component separation
We build a length-400 synthetic series additively combining a trend (quadratic, amplitude 0–8), a period-50 oscillation (amplitude 3), a period-12 oscillation (amplitude 1), and Gaussian noise (std 0.5), and apply SSA with window \(L=100\) .
import numpy as np

np.random.seed(3)
N = 400
n = np.arange(N)
trend = 8.0 * ((n - N / 2) / N) ** 2
period1 = 3.0 * np.sin(2 * np.pi * n / 50)
period2 = 1.0 * np.sin(2 * np.pi * n / 12)
noise = 0.5 * np.random.randn(N)
x = trend + period1 + period2 + noise

L = 100
K = N - L + 1
X = np.array([x[i:i + L] for i in range(K)]).T
U, s, Vt = np.linalg.svd(X, full_matrices=False)
contrib = s ** 2 / np.sum(s ** 2) * 100
print("Top-10 singular values:", np.round(s[:10], 3))
print("Top-10 contribution %:", np.round(contrib[:10], 3))

def diag_average(Xi, L, K, N):
    recon = np.zeros(N); counts = np.zeros(N)
    for ii in range(L):
        for jj in range(K):
            recon[ii + jj] += Xi[ii, jj]
            counts[ii + jj] += 1
    return recon / counts

# Reconstruct each eigentriple individually and identify it by correlation with ground truth
for i in range(6):
    comp = diag_average(s[i] * np.outer(U[:, i], Vt[i, :]), L, K, N)
    print(f"idx{i}: sigma={s[i]:.2f}  corr_trend={np.corrcoef(comp, trend)[0,1]:.3f} "
          f"corr_period50={np.corrcoef(comp, period1)[0,1]:.3f} corr_period12={np.corrcoef(comp, period2)[0,1]:.3f}")
Results (singular values and contribution):
| Index \(i\) | 0 | 1 | 2 | 3 | 4 | 5 | 6–19 (noise floor) |
|---|---|---|---|---|---|---|---|
| \(\sigma_i\) | 265.637 | 262.718 | 92.565 | 84.583 | 84.226 | 36.085 | 13.3 → 11.6 (gently decaying) |
| Contribution % | 41.24 | 40.34 | 5.01 | 4.18 | 4.15 | 0.76 | each < 0.1 |
Reconstructing each eigentriple individually and correlating it with the ground-truth components, \(i=0,1\) (a near-equal singular-value pair) correlate with the period-50 component at \(0.945\) /\(0.958\) , \(i=3,4\) (another pair) correlate with the period-12 component at \(0.969\) /\(0.989\) , and \(i=2\) and \(i=5\) (two non-adjacent, unpaired components) both correlate most strongly with the trend, at \(0.933\) /\(0.918\) — exactly as theory predicts: periodic components appear as near-equal singular-value pairs, while the trend appears as multiple unpaired eigentriples. From \(i=6\) onward the singular values decay only gently, from \(13.3\) to \(11.6\) , forming a noise floor uncorrelated with any true component.
Reconstructing the groups \(\{0,1\}\) (period-50), \(\{2,5\}\) (trend), and \(\{3,4\}\) (period-12) improves the correlations with ground truth to \(0.999\) , \(0.962\) , and \(0.986\) respectively, and just 6 signal components (\(i=0\) –\(5\) ) explain \(95.67\%\) of total variance. Using all \(100\) eigentriples for diagonal averaging gives a reconstruction error (max absolute deviation from the original) of \(1.29 \times 10^{-14}\) — machine precision — numerically confirming the identity from Section 3.2 that the SVD reproduces the original trajectory matrix exactly.
Panel (c) of the figure below shows the singular-value decay pattern: periodic components appear as adjacent same-colored pairs, the trend as two non-adjacent points, and the noise floor as a flat cluster — all visually separable.
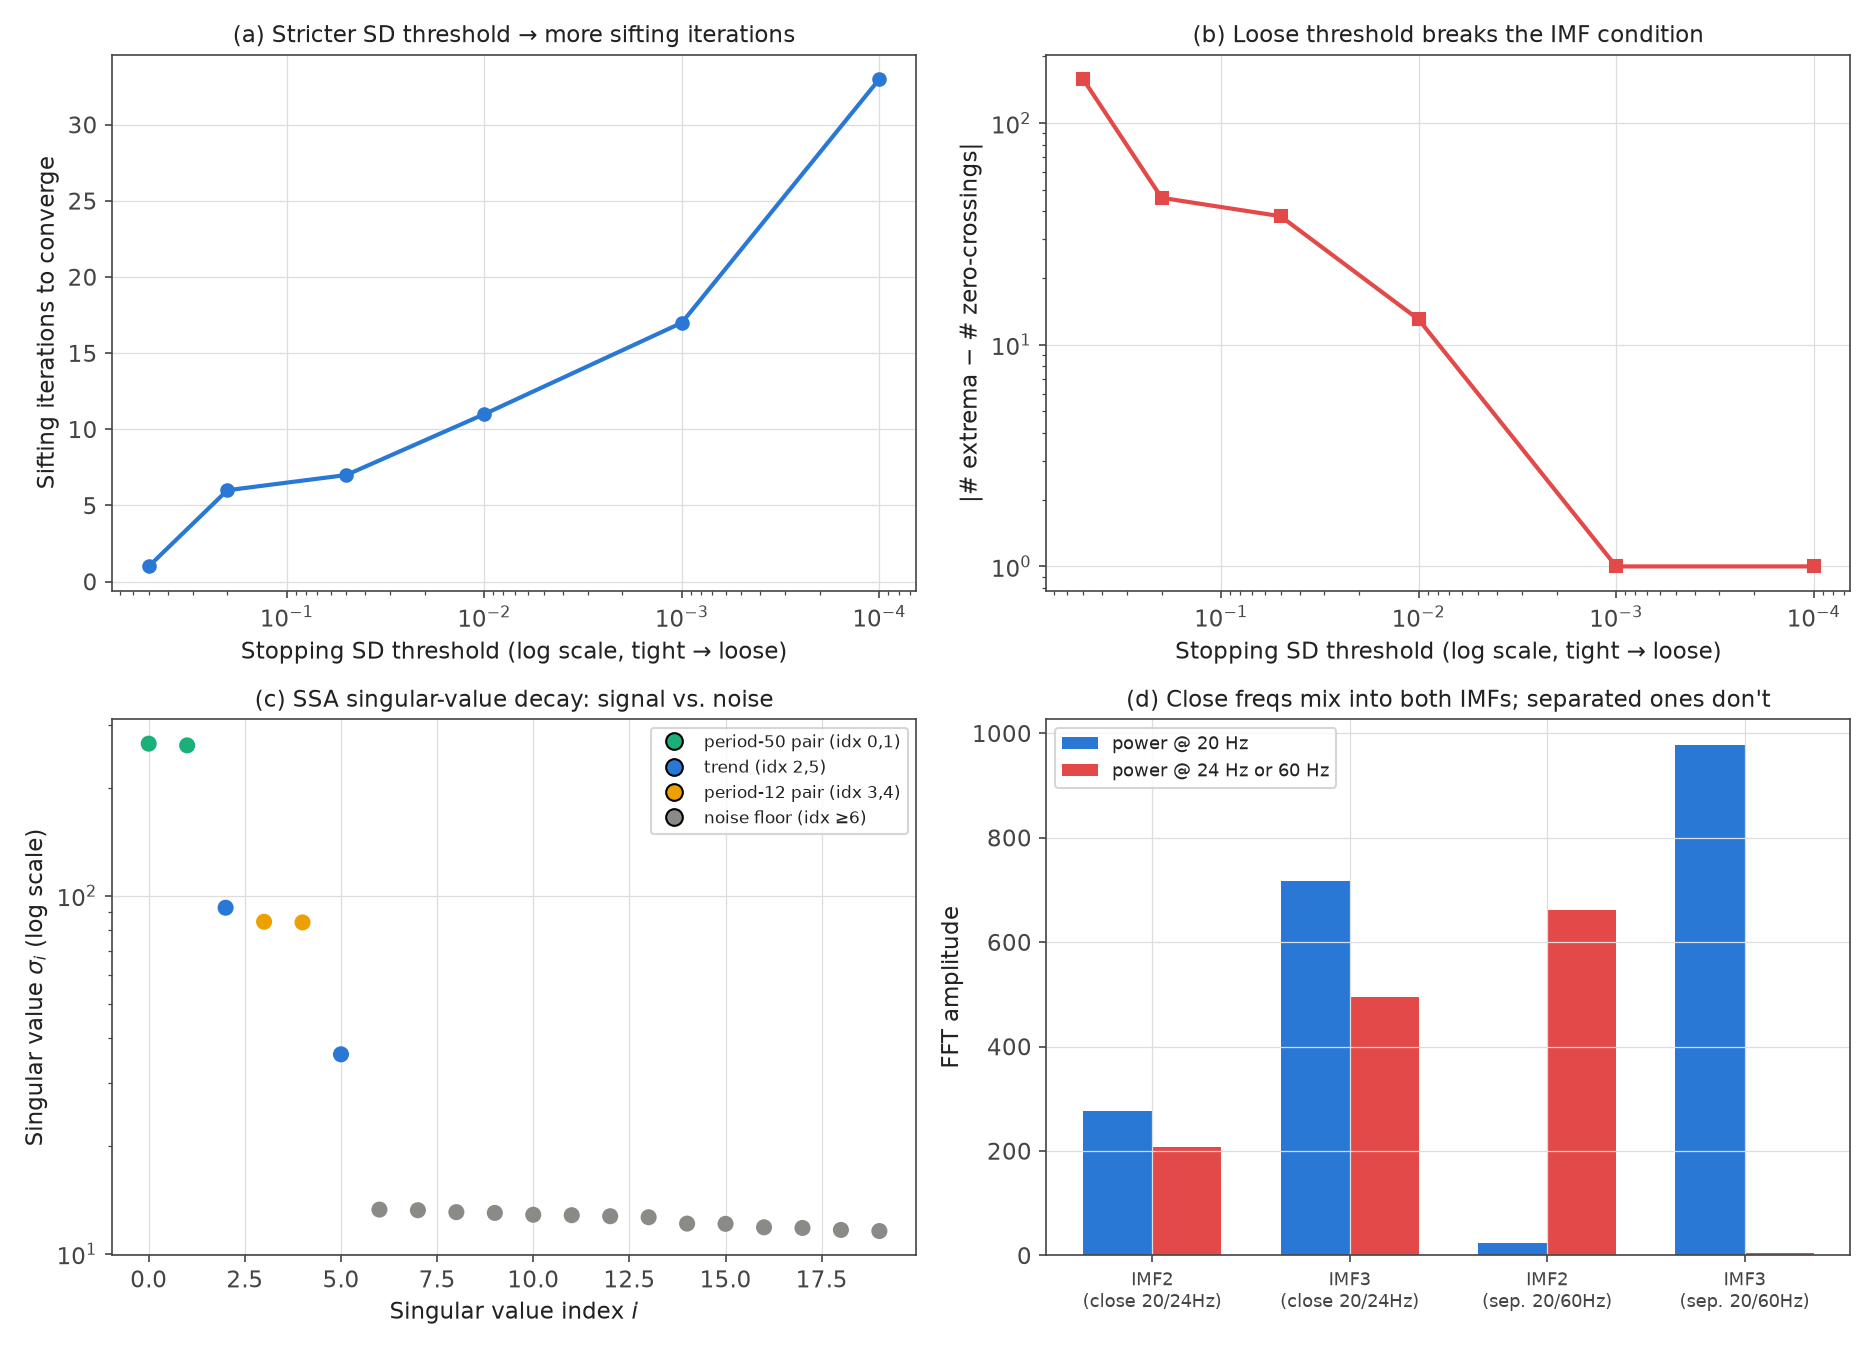
Figure: (a)(b) Sifting iterations and IMF-condition compliance as the SD stopping threshold varies (Section 1.4). (c) SSA singular-value decay and its correspondence to component groups (Section 3.5). (d) FFT amplitude confirming that close frequencies mix while separated ones don’t (Section 1.7).
4. Comparison
| Aspect | EMD | VMD | SSA |
|---|---|---|---|
| Foundation | Empirical (sifting) | Variational + ADMM | Trajectory matrix + SVD |
| Mode count | Adaptive | Pre-specified \(K\) | Pre-specified |
| Complexity | \(O(N \log N) \times\) sifts | \(O(K N \log N) \times\) ADMM iters | \(O(L N^2)\) (SVD) |
| Mode mixing | Common | Suppressed | Moderate |
| Frequency separation | Medium (EEMD improves) | High | Medium–High |
| Noise robustness | Weak (improved by EEMD) | Strong | Strong |
| Typical use | Bearings, biosignals | Mechanical vibration | Climate, finance trends |
5. Hilbert-Huang Transform: Instantaneous Frequency
Apply the Hilbert transform to each IMF \(c_k(t)\) to form the analytic signal \(z_k = c_k + j \mathcal{H}\{c_k\} = a_k(t) e^{j \phi_k(t)}\) . Instantaneous frequency is \(f_k(t) = (2\pi)^{-1} d\phi_k / dt\) . See https://yuhi-sa.github.io/en/posts/20260318_hilbert_transform/1/ for details.
from scipy.signal import hilbert

def hht(imfs, fs):
    analytic = hilbert(imfs, axis=-1)
    amp = np.abs(analytic)
    phase = np.unwrap(np.angle(analytic), axis=-1)
    freq = np.diff(phase, axis=-1) / (2 * np.pi) * fs
    return amp, freq

amp, freq = hht(imfs, fs)
HHT is used in bearing fault tracking, acoustic feature extraction, ECG R-wave analysis, and more.
6. Side-by-Side Comparison
from PyEMD import EMD as EMD_lib
from vmdpy import VMD

emd = EMD_lib()
imfs_emd = emd(x)
u_vmd, _, _ = VMD(x, alpha=2000, tau=0.0, K=4, DC=False, init=1, tol=1e-7)
ssa_modes, _ = ssa_decompose(x, L=200, n_components=4)

def dominant_freq(signal, fs):
    spec = np.abs(np.fft.rfft(signal))
    freqs = np.fft.rfftfreq(len(signal), 1 / fs)
    return freqs[np.argmax(spec)]

print("EMD dominant Hz:", [f"{dominant_freq(c, fs):.1f}" for c in imfs_emd[:4]])
print("VMD dominant Hz:", [f"{dominant_freq(c, fs):.1f}" for c in u_vmd])
print("SSA dominant Hz:", [f"{dominant_freq(c, fs):.1f}" for c in ssa_modes])
Practical guideline:
- Known mode count / stability → VMD
- Unknown / adaptive exploration → EMD (or EEMD)
- Short series / trend extraction → SSA
7. Applications
- Bearing diagnostics: extract modes near BPFO/BPFI fault frequencies, detect anomalies via instantaneous amplitude (VMD + HHT).
- ECG R-wave extraction: separate respiratory drift and pulse with SSA.
- Climate trend separation: yearly, seasonal, short-term variations into three SSA components.
- Acoustic scene analysis: VMD band-separates ambient and voice; feed into ML (see https://yuhi-sa.github.io/en/posts/20260525_ml_timeseries_guide/1/).
8. Recent Research Trends: Convergence with Deep Learning
EMD, VMD, and SSA were all established between the 1990s and 2010s, but since 2023 research combining them with deep learning has become more active.
- Replacing sifting with a neural network: Zhou, Cicone, and Zhou’s (2023) RRCNN (Recurrent Residue Convolutional Neural Network, arXiv:2307.01725) proposes a deep-learning model that computes the “local mean” directly via a convolutional residual structure, instead of iterative envelope averaging. The authors report reduced boundary effects, mode mixing, and noise sensitivity compared to classical EMD — one engineering answer to the locality-driven limitations of sifting explained mathematically in Section 1.6.
- Transformers with embedded decomposition: in time-series forecasting, architectures that decompose the input into trend/seasonal components before applying attention have become widespread. EDformer (2024, arXiv:2412.12227) embeds this “decomposition inside the model” directly into the architecture, pointing toward replacing classical moving-average-based decomposition with a learnable counterpart. The broader relationship between frequency-domain transforms and deep time-series models is surveyed in a 2023 paper (arXiv:2302.02173, “A Survey on Deep Learning based Time Series Analysis with Frequency Transformation”).
- Mode decomposition as feature engineering (“decomposition-ensemble” pipelines): pipelines that train an independent forecasting model (e.g. an LSTM) on each IMF obtained from EMD/EEMD/VMD and sum the predictions continue to be studied in finance and energy-demand forecasting (e.g. asset-price prediction combining EMD with Gaussian mixture models, arXiv:2503.20678, 2025). In this setup, an IMF corrupted by mode mixing that is fed downstream directly degrades forecast accuracy, so the understanding of stopping criteria and mode mixing developed in this article bears directly on feature-engineering quality.
These efforts broadly split into two directions: making mode decomposition itself more sophisticated, and connecting mode decomposition as a preprocessing step to deep learning. Both are still maturing, and it is worth noting that the theoretical convergence and interpretability of deep-learning-based decomposition models are not yet as well established as those of classical EMD/SSA.
9. Learning Checklist
- Two IMF conditions
- Why subtracting the local mean pushes sifting toward the IMF condition, from the envelope’s interpolation property
- The SD and S-number stopping criteria — their formulas and respective weaknesses
- Which edge case (over-sifting vs. under-sifting) results from too-loose or too-strict thresholds
- Why mode mixing occurs for close frequencies and intermittent signals, from the locality of sifting
- Difference between EEMD and CEEMDAN
- Center-frequency update in VMD
- Role of ADMM dual variable
- Deriving the SVD decomposition of the trajectory matrix into eigentriples
- SSA’s weak separability (why periodic components appear as pairs)
- Implementing diagonal averaging
- Relation between Hilbert transform and instantaneous frequency
- Minimal code with PyEMD / vmdpy / numpy.linalg.svd
Related Articles
- https://yuhi-sa.github.io/en/posts/20260714_ceemdan_hht/1/ — CEEMDAN resolves EEMD’s reconstruction error and mode splitting, with the marginal Hilbert spectrum and bearing fault diagnosis (advanced follow-up)
- https://yuhi-sa.github.io/en/posts/20260524_time_frequency_guide/1/ — Time-Frequency Analysis Selection Hub
- https://yuhi-sa.github.io/en/posts/20260318_hilbert_transform/1/ — Hilbert Transform and Analytic Signal
- https://yuhi-sa.github.io/en/posts/20260226_wavelet/1/ — Wavelet Transform
- https://yuhi-sa.github.io/en/posts/20260522_wavelet_packet/1/ — Wavelet Packet Decomposition
- https://yuhi-sa.github.io/en/posts/20260429_stft/1/ — Short-Time Fourier Transform
- https://yuhi-sa.github.io/en/posts/20260225_fft/1/ — Fast Fourier Transform
- https://yuhi-sa.github.io/en/posts/20260228_fft_window_psd/1/ — Window Functions and PSD
- https://yuhi-sa.github.io/en/posts/20260228_timeseries_anomaly/1/ — Time-Series Anomaly Detection
- https://yuhi-sa.github.io/en/posts/20260525_ml_timeseries_guide/1/ — ML Time-Series Hub