Why Bundle the Fundamentals of Discrete Signal Processing?
When you cross over from continuous-time signal processing into the discrete-time world, you immediately get hit by a flood of similar-looking acronyms and formulas — sampling theorem → DTFT → DFT/FFT → Z-transform → interpolation → correlation → compression. Reading individual articles one at a time can leave you wondering how they all actually fit together.
This blog has been steadily building out the core discrete-DSP topics in dedicated articles. The six fundamental ones are:
- https://yuhi-sa.github.io/en/posts/20260430_sampling_theorem/1/ — Sampling theorem, Nyquist frequency, and aliasing
- https://yuhi-sa.github.io/en/posts/20260430_signal_interpolation/1/ — Signal reconstruction and interpolation (sinc / linear / spline)
- https://yuhi-sa.github.io/en/posts/20260505_dtft_dft_fft/1/ — The relationship between DTFT, DFT, and FFT
- https://yuhi-sa.github.io/en/posts/20260430_z_transform/1/ — The Z-transform, transfer functions, and pole-zero analysis
- https://yuhi-sa.github.io/en/posts/20260429_autocorrelation/1/ — Autocorrelation and cross-correlation
- https://yuhi-sa.github.io/en/posts/20260430_dct/1/ — The discrete cosine transform (DCT)
Each is self-contained, but they all share the same mathematical backbone: how to treat a continuous-time signal as a discrete sequence. This hub stitches those six together with the surrounding topics of filter design, time-frequency analysis, and the higher-level meta-roadmap, with the goal of giving you a single picture of how to navigate the first few months of discrete signal processing.
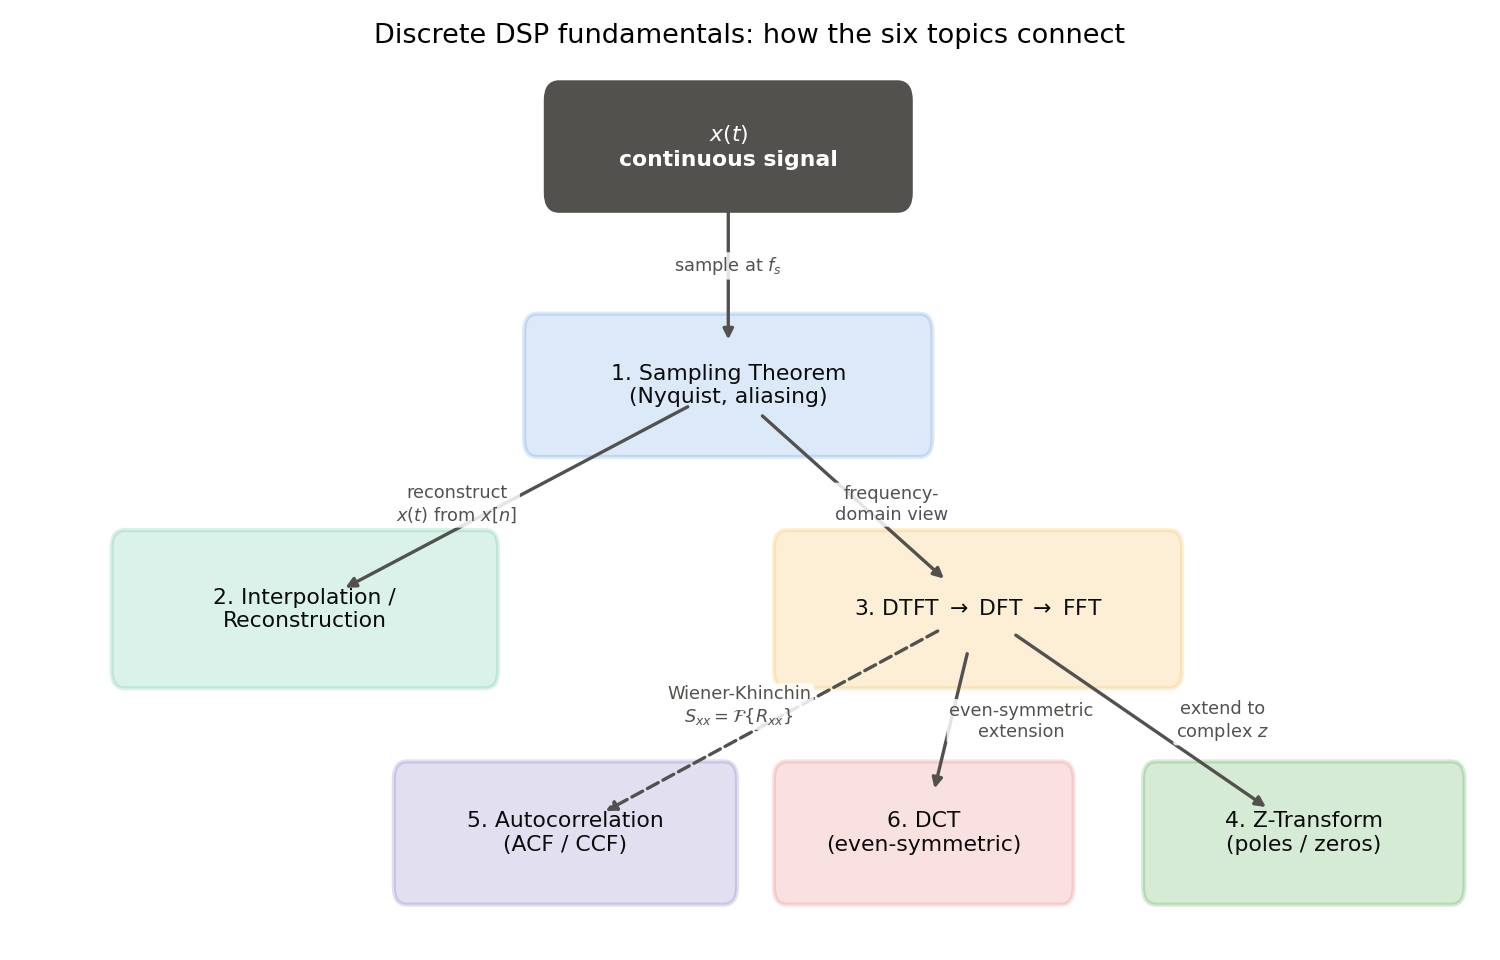
The diagram below shows how the six topics connect mathematically. Starting from the sampling theorem, the path branches into interpolation/reconstruction in the time domain and into the DTFT in the frequency domain; the DTFT in turn branches into the Z-transform (extension to the complex \(z\) -plane) and the DFT/FFT (discretization of the frequency axis). The DFT/FFT further connects to the DCT (even-symmetric extension) and, via the Wiener–Khinchin theorem, to autocorrelation.
If you have already worked through the top-level roadmap, returning to https://yuhi-sa.github.io/en/posts/20260528_dsp_ml_roadmap/1/ makes it easier to see where this hub fits in the bigger picture.
1. Learning Roadmap by Level
The right reading order for discrete DSP depends on where you are starting from. Here are four tracks.
Level 1 — Complete beginner (little continuous-signal background)
Goal: understand the difference between continuous and discrete signals, and pick up the core vocabulary around the Nyquist frequency and aliasing.
- https://yuhi-sa.github.io/en/posts/20260225_fft/1/ — Get comfortable with the frequency representation of discrete time via an FFT primer
- https://yuhi-sa.github.io/en/posts/20260430_sampling_theorem/1/ — Sampling theorem, Nyquist, and aliasing
- https://yuhi-sa.github.io/en/posts/20260225_moving_average/1/ — Experience discrete-time convolution through the moving average
- https://yuhi-sa.github.io/en/posts/20260430_signal_interpolation/1/ — First encounter with sinc interpolation
Estimated time: 2–4 weeks. The goal is to be able to confidently draw a frequency axis with numpy.fft.fftfreq.
Level 2 — Continuous-to-discrete bridge (systematizing DTFT, DFT, Z-transform)
Goal: internalize the correspondence between continuous-time Fourier/Laplace and discrete-time DTFT/Z-transform.
- https://yuhi-sa.github.io/en/posts/20260430_sampling_theorem/1/ — The spectrum-replication formula (Eq. (5))
- https://yuhi-sa.github.io/en/posts/20260505_dtft_dft_fft/1/ — DTFT is a continuous-frequency representation; DFT discretizes it
- https://yuhi-sa.github.io/en/posts/20260430_z_transform/1/ — The Z-transform extends DTFT to the complex z-plane
- https://yuhi-sa.github.io/en/posts/20260228_fft_window_psd/1/ — Window functions and PSD estimation
- https://yuhi-sa.github.io/en/posts/20260429_autocorrelation/1/ — The Wiener–Khinchin theorem (ACF ↔ PSD)
Estimated time: 4–6 weeks.
Level 3 — Python-implementation focus (hands-on with scipy/numpy APIs)
Goal: get fluent with the practical differences between scipy.fft and numpy.fft, resampling techniques, and fast correlation.
- https://yuhi-sa.github.io/en/posts/20260430_signal_interpolation/1/ —
scipy.signal.resample,resample_poly,decimate - https://yuhi-sa.github.io/en/posts/20260429_autocorrelation/1/ —
numpy.correlateand FFT-based \(O(N\log N)\) computation - https://yuhi-sa.github.io/en/posts/20260430_dct/1/ —
scipy.fft.dct, MDCT, 2-D DCT - https://yuhi-sa.github.io/en/posts/20260430_z_transform/1/ —
scipy.signal.tf2zpk,freqz - https://yuhi-sa.github.io/en/posts/20260505_dtft_dft_fft/1/ —
numpy.fft.fftand zero-padding
Estimated time: 6–8 weeks.
Level 4 — Applications (filter design, time-frequency analysis, ML preprocessing)
Goal: connect the fundamentals of discrete DSP into the filter-design hub, time-frequency hub, and ML time-series hub.
- https://yuhi-sa.github.io/en/posts/20260522_filter_design_guide/1/ — Move on to the filter-design guide hub
- https://yuhi-sa.github.io/en/posts/20260524_time_frequency_guide/1/ — Move on to the time-frequency analysis hub
- https://yuhi-sa.github.io/en/posts/20260525_ml_timeseries_guide/1/ — Move on to the ML time-series hub
- https://yuhi-sa.github.io/en/posts/20260528_dsp_ml_roadmap/1/ — The overall DSP/ML meta-roadmap
Estimated time: 8–12 weeks running in parallel.
2. Bridging Continuous Signals to Discrete Signals
Converting a continuous-time signal \(x(t)\) into a discrete-time sequence \(x[n]\) is the starting point of this entire series.
The sampling theorem (Nyquist–Shannon)
A band-limited signal \(x(t)\) (with \(X(f) = 0\) for \(|f| > f_{\max}\) ) can be perfectly recovered from samples \(\{x[n]\}\) provided the sampling rate \(f_s\) satisfies
\[f_s > 2 f_{\max}.\]The full proof, the spectrum-replication formula, and implementation examples live in https://yuhi-sa.github.io/en/posts/20260430_sampling_theorem/1/.
Spectra before and after sampling
| Domain | Representation | Periodicity |
|---|---|---|
| Continuous time | \(X(f)\) | Aperiodic |
| Discrete time | \(X(e^{j\omega})\) (DTFT) | \(2\pi\) -periodic (frequency wraps) |
| Discrete time + frequency | \(X[k]\) (DFT) | Period \(N\) in both time and frequency |
The discretization from DTFT to DFT, and the FFT as a fast algorithm for it, are covered in detail in https://yuhi-sa.github.io/en/posts/20260505_dtft_dft_fft/1/.
Why components above the limit become indistinguishable (deriving the aliased frequency)
The reason the sampling theorem requires \(f_s\) to exceed \(2f_{\max}\) can be derived concretely from a single sinusoid. A sinusoid of frequency \(f_0\) sampled at rate \(f_s\) gives the sequence
\( x[n] = \cos\!\left(2\pi \dfrac{f_0}{f_s}\, n\right) \)
Since \(e^{j2\pi k n} = 1\) for any integer \(k\) ,
\( x[n] = \cos\!\left(2\pi \dfrac{f_0 - k f_s}{f_s}\, n\right) \)
holds for every integer \(k\) . In other words, looking only at the sample sequence, a sinusoid at frequency \(f_0\) is indistinguishable from one at frequency
\( f_0 - k f_s \)
for any integer \(k\) . Choosing \(k\) so the observed frequency falls in the principal band \([0, f_s/2]\) gives the aliased-frequency formula
\( f_{\text{alias}} = \left\lvert f_0 - \mathrm{round}\!\left(\dfrac{f_0}{f_s}\right) f_s \right\rvert \)
(the full proof and the spectrum-replication formula are in https://yuhi-sa.github.io/en/posts/20260430_sampling_theorem/1/; this is exactly the formula you self-check against in checklist item 3 of Section 7). Let’s confirm this formula matches actual FFT peak positions at four frequencies.
import numpy as np

fs = 100.0  # sampling frequency [Hz]
N = 200
t = np.arange(N) / fs

for f_true in [10.0, 45.0, 65.0, 110.0]:
    x = np.cos(2 * np.pi * f_true * t)
    X = np.fft.rfft(x)
    freqs = np.fft.rfftfreq(N, d=1 / fs)
    f_observed = freqs[np.argmax(np.abs(X))]
    f_alias_pred = abs(f_true - round(f_true / fs) * fs)
    print(f"f_true={f_true:6.1f} Hz  observed_peak={f_observed:6.2f} Hz  predicted_alias={f_alias_pred:6.2f} Hz")
Output (Python 3.14.6 / NumPy 2.4.2):
f_true=  10.0 Hz  observed_peak= 10.00 Hz  predicted_alias= 10.00 Hz
f_true=  45.0 Hz  observed_peak= 45.00 Hz  predicted_alias= 45.00 Hz
f_true=  65.0 Hz  observed_peak= 35.00 Hz  predicted_alias= 35.00 Hz
f_true= 110.0 Hz  observed_peak= 10.00 Hz  predicted_alias= 10.00 Hz
With \(f_s = 100\,\text{Hz}\) , the Nyquist frequency is \(50\,\text{Hz}\) . 65 Hz and 110 Hz exceed it, so the observed peaks alias to 35 Hz and 10 Hz exactly as the derived formula predicts, and the FFT peak positions match the predicted values exactly. Both the proof and the numerical check confirm why this hub teaches the sampling theorem first — every downstream topic (DTFT, DFT, the Z-transform) is built on the assumption that you are operating below the Nyquist frequency.
Mitigating aliasing
The role of the analog LPF (the anti-aliasing filter) before sampling, and the AAF design used before downsampling, are discussed both in https://yuhi-sa.github.io/en/posts/20260430_sampling_theorem/1/ and — from a filter-design perspective — in https://yuhi-sa.github.io/en/posts/20260522_filter_design_guide/1/, https://yuhi-sa.github.io/en/posts/20260223_lowpass_filter/1/, and https://yuhi-sa.github.io/en/posts/20260226_butterworth/1/.
3. Frequency Representations of Discrete-Time Signals
The DTFT / DFT / FFT hierarchy
The relationship between the three can be summarized in one line each:
- DTFT: a continuous frequency representation of \(x[n]\) (\(\omega \in [0, 2\pi)\) )
- DFT: the finite-length version obtained by sampling the DTFT at \(N\) equally spaced points on the frequency axis
- FFT: an algorithm that computes the DFT in \(O(N \log N)\) time
See https://yuhi-sa.github.io/en/posts/20260505_dtft_dft_fft/1/ for the full treatment.
DTFT / DFT / FFT comparison table
| Axis | DTFT | DFT | FFT |
|---|---|---|---|
| Time axis | Discrete \(n \in \mathbb{Z}\) | Discrete \(n = 0, \dots, N-1\) | Discrete \(n = 0, \dots, N-1\) |
| Frequency axis | Continuous \(\omega \in [0,2\pi)\) | Discrete \(k = 0, \dots, N-1\) | Discrete \(k = 0, \dots, N-1\) |
| Computational cost | Analytical (closed form) | \(O(N^2)\) | \(O(N \log N)\) |
| Main use | Theoretical analysis | Numerical spectrum evaluation | Standard in practice |
| Primary API | (closed form) | Direct computation | numpy.fft.fft |
Deriving the DFT as “N samples of the DTFT”
For a finite-length signal \(x[n]\) (\(n=0,\dots,N-1\) ), the DTFT is defined as
\[X(e^{j\omega}) = \sum_{n=0}^{N-1} x[n]\, e^{-j\omega n}\]where \(\omega\) can take any continuous value. Restricting \(\omega\) to the \(N\) equally spaced points \(\omega_k = 2\pi k / N\) (\(k=0,\dots,N-1\) ) gives
\( X[k] = X(e^{j\omega_k}) = \sum_{n=0}^{N-1} x[n]\, e^{-j2\pi kn/N} \)
which is exactly the definition of the DFT (https://yuhi-sa.github.io/en/posts/20260505_dtft_dft_fft/1/ also states this relationship; here we verify it numerically). In other words, the DFT is not a new transform — it is nothing more than the DTFT sampled at \(N\) equally spaced frequency points. Increasing \(N\) via zero-padding does not change the underlying signal (the number of nonzero samples), so it merely “samples the same DTFT more densely” without adding information (checklist item 8 in Section 7).
import numpy as np

np.random.seed(1)
x = np.random.randn(8)

N = len(x)
k = np.arange(N)
n = np.arange(N)
W = np.exp(-2j * np.pi * np.outer(k, n) / N)  # sample the DTFT at omega_k = 2*pi*k/N
X_manual = W @ x
X_fft = np.fft.fft(x)
print("max |X_manual - X_fft| =", np.max(np.abs(X_manual - X_fft)))
Output:
max |X_manual - X_fft| = 6.575670183899638e-15
The error is on the order of double-precision floating-point rounding error (\(10^{-15}\)
), confirming numerically that the direct sum from the DFT definition and np.fft.fft agree in theory as well as in practice.
Relationship to the Z-transform
The DTFT is the Z-transform \(X(z)\) restricted to the unit circle \(z = e^{j\omega}\) . More precisely, when the region of convergence of the Z-transform \(X(z) = \sum_n x[n] z^{-n}\) includes the unit circle,
\( X(z)\Big|_{z=e^{j\omega}} = \sum_{n} x[n]\, e^{-j\omega n} = X(e^{j\omega}) \)
which shows the two coincide. Working in the Z-domain lets you see poles, zeros, the frequency response, and stability all at once, which makes it the theoretical foundation of filter design. For the details see https://yuhi-sa.github.io/en/posts/20260430_z_transform/1/.
This evaluation on the unit circle is exactly what scipy.signal.freqz computes internally — it is the operation that takes a transfer function \(H(z)\)
to a frequency response \(H(e^{j\omega})\)
. Comparing a manual computation against freqz’s output:
import numpy as np
from scipy import signal

b, a = [1.0], [1.0, -0.5]  # H(z) = 1 / (1 - 0.5 z^-1)
w, H_freqz = signal.freqz(b, a, worN=8)
H_manual = 1.0 / (1.0 - 0.5 * np.exp(-1j * w))
print("max |H_freqz - H_manual| =", np.max(np.abs(H_freqz - H_manual)))
Output:
max |H_freqz - H_manual| = 0.0
The frequency response returned by freqz matches the Z-transform’s defining formula, evaluated directly on the unit circle, with zero error.
DCT is the even-symmetric counterpart of DFT
For real signals where you want to avoid the Gibbs phenomenon at the boundaries and concentrate energy into low-frequency coefficients, the DCT is the natural choice. It is used in nearly every lossy compression standard — JPEG, MP3, H.264, and so on. See https://yuhi-sa.github.io/en/posts/20260430_dct/1/ for details.
4. Mathematical Operations on Discrete Signals
Z-transform and transfer functions
Taking the Z-transform of both sides of a difference equation
\[\sum_{k=0}^{N} a_k\, y[n-k] = \sum_{k=0}^{M} b_k\, x[n-k]\]yields the transfer function
\[H(z) = \frac{Y(z)}{X(z)} = \frac{\sum_k b_k z^{-k}}{\sum_k a_k z^{-k}} = \frac{B(z)}{A(z)}.\]The system is BIBO stable iff all poles lie strictly inside the unit circle. See https://yuhi-sa.github.io/en/posts/20260430_z_transform/1/ for the full discussion. Reading https://yuhi-sa.github.io/en/posts/20260430_phase_group_delay/1/ alongside it adds a more concrete picture of stability, frequency response, and group delay.
That \(z^{-1}\) corresponds to “one sample of delay” follows directly from the definition of the Z-transform. The Z-transform of \(y[n] = x[n-k]\) is
\( \mathcal{Z}\{x[n-k]\} = \sum_{n} x[n-k]\, z^{-n} = \sum_{m} x[m]\, z^{-(m+k)} = z^{-k} \sum_{m} x[m]\, z^{-m} = z^{-k} X(z) \)
(substituting \(m = n-k\) ). Applying this shift theorem term by term to the difference equation reproduces the transfer-function formula above directly — since the transform of \(y[n-k]\) is \(z^{-k}Y(z)\) and the transform of \(x[n-k]\) is \(z^{-k}X(z)\) , dividing both sides by \(X(z)\) immediately gives \(H(z) = B(z)/A(z)\) (checklist item 9 in Section 7).
Recent research: the “continuous-to-discrete bridge” this hub is built around is not a purely historical topic. Mamba (Gu & Dao, “Mamba: Linear-Time Sequence Modeling with Selective State Spaces,” arXiv:2312.00752 , 2023) discretizes the continuous-time state-space model \(\dot h(t) = Ah(t) + Bx(t)\) via a zero-order hold (ZOH) into the discrete recurrence
\( h_t = \bar{A}h_{t-1} + \bar{B}x_t \)
and achieves Transformer-competitive sequence-modeling performance in linear time. The mathematical structure of this discretization is essentially identical to the one-sample-delay argument for \(z^{-1}\) derived above — a solid grounding in discrete DSP fundamentals pays off directly when reading cutting-edge sequence-modeling research.
Autocorrelation and cross-correlation
The autocorrelation function (ACF) is used to detect periodicity in a signal, while the cross-correlation function (CCF) is used for delay estimation. By the Wiener–Khinchin theorem, the Fourier transform of the ACF is the power spectral density (PSD):
\[S_{xx}(f) = \mathcal{F}\{R_{xx}(\tau)\}.\]With the FFT, this can be computed in \(O(N \log N)\) time. See https://yuhi-sa.github.io/en/posts/20260429_autocorrelation/1/.
Why the PSD and the ACF are linked by a Fourier transform (deriving the Wiener–Khinchin theorem): https://yuhi-sa.github.io/en/posts/20260502_convolution_correlation/1/ mentions this theorem too, but usually as a given fact rather than a derivation — so let’s derive it here. For a length-\(N\) signal, the periodogram (a PSD estimate) is defined as \(S[k] = |X[k]|^2/N\) . Expanding this,
\( S[k] = \frac{1}{N}\left(\sum_{n} x[n]\, e^{-j2\pi kn/N}\right)\left(\sum_{m} x[m]\, e^{+j2\pi km/N}\right) = \frac{1}{N}\sum_{n}\sum_{m} x[n]x[m]\, e^{-j2\pi k(n-m)/N} \)
Substituting \(l = n - m \bmod N\) (a circular shift) and re-summing over \(l\) ,
\( S[k] = \sum_{l} \left(\frac{1}{N}\sum_{n} x[n]\, x[(n-l) \bmod N]\right) e^{-j2\pi kl/N} = \sum_l R[l]\, e^{-j2\pi kl/N} = \mathrm{DFT}\{R\}[k] \)
so the periodogram \(S[k]\) equals the DFT of the circular autocorrelation \(R[l]\) — this is the discrete-time form of the Wiener–Khinchin theorem. Equivalently, \(R = \mathrm{IDFT}\{S\}\) recovers the autocorrelation. Confirming numerically:
import numpy as np

np.random.seed(2)
N = 4096
x = np.random.randn(N)

# Circular ACF, computed directly from the definition
R_direct = np.array([np.dot(x, np.roll(x, -m)) / N for m in range(6)])
print("R_direct[0..5]  =", np.round(R_direct, 4))

# Wiener-Khinchin: circular ACF = IFFT(periodogram)
S_periodogram = np.abs(np.fft.fft(x)) ** 2 / N
R_from_fft = np.fft.ifft(S_periodogram).real
print("R_from_fft[0..5] =", np.round(R_from_fft[:6], 4))

print("max |R_direct - R_from_fft[:6]| =", np.max(np.abs(R_direct - R_from_fft[:6])))
Output:
R_direct[0..5]  = [ 1.0247  0.0087 -0.011  -0.0112 -0.0136  0.0067]
R_from_fft[0..5] = [ 1.0247  0.0087 -0.011  -0.0112 -0.0136  0.0067]
max |R_direct - R_from_fft[:6]| = 2.220446049250313e-16
Two independent computation paths (a direct time-domain sum and an FFT-based route) agree to within rounding error (\(2.22\times10^{-16}\) , machine epsilon), confirming the theorem numerically as well as analytically.
Convolution and correlation
The article https://yuhi-sa.github.io/en/posts/20260502_convolution_correlation/1/, which organizes the relationship among convolution, correlation, and the Wiener–Khinchin theorem, makes a natural complement to this section.
5. Interpolation and Reconstruction
Recovering the continuous signal \(x(t)\) from its samples \(x[n]\) — reconstruction — and adjusting the sampling rate — interpolation — are two sides of the same coin.
Comparison of major interpolation methods
| Method | Frequency response | Cost | Main use | API |
|---|---|---|---|---|
| sinc (ideal) | Ideal LPF | Infinite sum (must truncate) | Theoretical reconstruction (sampling thm.) | numpy.sinc |
| Linear | \(\text{sinc}^2\) roll-off | \(O(N)\) | Lightweight visualization, low-quality audio | numpy.interp |
| Cubic | Steeper roll-off | \(O(N)\) | Image resizing | scipy.interpolate.interp1d |
| Spline | Smooth \(C^2\) continuity | \(O(N)\) | Numerical analysis, physics simulations | scipy.interpolate.CubicSpline |
| FFT resampling | Equivalent sinc via FFT | \(O(N \log N)\) | Resampling at arbitrary ratios | scipy.signal.resample |
| Polyphase | Built-in anti-aliasing | \(O(N)\) | High-efficiency resampling | scipy.signal.resample_poly |
For theory and implementation details see https://yuhi-sa.github.io/en/posts/20260430_signal_interpolation/1/.
Why linear interpolation has a \(\text{sinc}^2\) roll-off
https://yuhi-sa.github.io/en/posts/20260430_signal_interpolation/1/ states the fact that “the Fourier transform of a triangle function is \(\text{sinc}^2\) ,” but here we derive why, using the convolution theorem. The linear-interpolation kernel (a triangle, or tent function) equals a rectangular (zero-order-hold) kernel of width \(T\) convolved with itself:
\( \mathrm{tri}_T(t) = \mathrm{rect}_T(t) * \mathrm{rect}_T(t) \)
By the convolution theorem (the Fourier transform of a convolution is the product of the individual Fourier transforms),
\( \mathcal{F}\{\mathrm{tri}_T\}(f) = \mathcal{F}\{\mathrm{rect}_T\}(f) \cdot \mathcal{F}\{\mathrm{rect}_T\}(f) = \big[\mathcal{F}\{\mathrm{rect}_T\}(f)\big]^2 \)
and since \(\mathcal{F}\{\mathrm{rect}_T\}(f) = T\,\text{sinc}(fT)\) (with \(\text{sinc}(x) = \sin(\pi x)/(\pi x)\) ),
\( \mathcal{F}\{\mathrm{tri}_T\}(f) = T^2\, \text{sinc}^2(fT) \)
follows. This is the origin of the “\(\text{sinc}^2\) roll-off” listed in the table above — not an assumed fact, but a direct consequence of the convolution theorem. Ideal sinc interpolation instead uses a kernel that is rectangular in the frequency domain (an ideal LPF), so it has no roll-off at all, at the cost of an infinitely long kernel in the time domain — this contrast is the mathematical basis for the difference in the “Frequency response” column of the table.
Confirming the convolution theorem itself numerically on a discrete signal:
import numpy as np

Npad = 2048
M = 8  # width of the rectangular (zero-order-hold) kernel

rect = np.zeros(Npad)
rect[:M] = 1.0

tri_conv = np.convolve(rect, rect)[:Npad]  # triangle kernel = rect (*) rect (convolution)

R = np.fft.fft(rect, n=Npad)
T_direct = np.fft.fft(tri_conv, n=Npad)
T_from_R2 = R**2

print("max |FFT(rect (*) rect) - FFT(rect)^2| =", np.max(np.abs(T_direct - T_from_R2)))
print("max |FFT(rect)| (reference scale)      =", np.max(np.abs(R)))
Output:
max |FFT(rect (*) rect) - FFT(rect)^2| = 2.3832327871173822e-14
max |FFT(rect)| (reference scale)      = 8.0
The direct convolution and the squared FFT spectrum agree to within rounding error (a relative error of about \(3\times10^{-15}\)
against the reference scale of 8.0), confirming numerically that the \(\text{sinc}^2\)
roll-off of linear interpolation is a direct consequence of the convolution theorem.
Upsampling and downsampling
- Decimation: AAF → keep one sample out of every \(M\)
. Use
scipy.signal.decimate. - Interpolation: zero-insertion → image-rejection LPF. Use
scipy.signal.resample_poly.
For a systematic treatment of decimation, interpolation, rational L/M rate conversion, and polyphase decomposition, see https://yuhi-sa.github.io/en/posts/20260702_multirate_signal_processing/1/. If you want to dig into LPF design, move on to https://yuhi-sa.github.io/en/posts/20260223_lowpass_filter/1/, https://yuhi-sa.github.io/en/posts/20260226_butterworth/1/, and https://yuhi-sa.github.io/en/posts/20260226_fir_iir/1/.
6. Applications — Connecting to the Surrounding Hubs
A. Filter design
Every operation that reshapes the frequency response of a discrete signal ultimately reduces to placing poles and zeros in the Z-domain. Once you have internalized the Z-transform and the DTFT in this hub, the natural next step is https://yuhi-sa.github.io/en/posts/20260522_filter_design_guide/1/, which covers how to choose among IIR/FIR, Butterworth/Chebyshev/Bessel, and notch/bandpass designs. Concrete articles:
- https://yuhi-sa.github.io/en/posts/20260226_butterworth/1/ — Butterworth
- https://yuhi-sa.github.io/en/posts/20260314_chebyshev_filter/1/ — Chebyshev
- https://yuhi-sa.github.io/en/posts/20260316_bessel_filter/1/ — Bessel
- https://yuhi-sa.github.io/en/posts/20260226_fir_iir/1/ — FIR vs IIR
- https://yuhi-sa.github.io/en/posts/20260228_notch_filter/1/ — Notch
- https://yuhi-sa.github.io/en/posts/20260312_bandpass_filter/1/ — Bandpass
- https://yuhi-sa.github.io/en/posts/20260313_highpass_filter/1/ — Highpass
- https://yuhi-sa.github.io/en/posts/20260223_lowpass_filter/1/ — Lowpass
B. Time-frequency analysis
Sliding a windowed DFT/FFT along time gives you the STFT, and adapting the resolution to the time scale gives you wavelets. The hub is https://yuhi-sa.github.io/en/posts/20260524_time_frequency_guide/1/.
- https://yuhi-sa.github.io/en/posts/20260429_stft/1/ — STFT
- https://yuhi-sa.github.io/en/posts/20260226_wavelet/1/ — Wavelet transform
- https://yuhi-sa.github.io/en/posts/20260318_hilbert_transform/1/ — Hilbert transform
- https://yuhi-sa.github.io/en/posts/20260528_mode_decomposition/1/ — EMD/VMD/SSA
C. Machine-learning preprocessing
A pipeline that feeds features such as STFT average power, wavelet energy, and autocorrelation lags into an ML model is centralized in https://yuhi-sa.github.io/en/posts/20260525_ml_timeseries_guide/1/. Concrete examples:
- https://yuhi-sa.github.io/en/posts/20260228_timeseries_anomaly/1/ — Time-series anomaly detection
- https://yuhi-sa.github.io/en/posts/20260226_arima/1/ — ARIMA (order selection via ACF/PACF)
- https://yuhi-sa.github.io/en/posts/20260317_lstm_timeseries/1/ — LSTM time-series
D. Returning to the meta-roadmap
The meta-roadmap that ties the five major hubs together with this one is https://yuhi-sa.github.io/en/posts/20260528_dsp_ml_roadmap/1/. It is the right place to come back to whenever you want to revisit the level-based learning paths.
7. Learning Checklist
A 14-item self-check to see whether the continuous-to-discrete bridge has really sunk in.
Sampling and interpolation
- You can articulate the difference between the Nyquist frequency and the Nyquist rate
- You can write the spectrum-replication formula \(X_s(f) = f_s \sum_k X(f - k f_s)\)
- You can compute the aliased frequency \(|f - \text{round}(f/f_s) \cdot f_s|\) by hand
- You can explain the frequency-response difference between sinc and linear interpolation (the \(\text{sinc}^2\) roll-off)
- You can describe when to use
scipy.signal.resampleversusresample_poly
DTFT, DFT, and FFT
- You can instantly say “DTFT is a continuous-frequency representation, DFT is its discrete version, FFT is a fast DFT algorithm”
- You can produce a correct frequency axis from
numpy.fft.fftoutput length usingfftfreq - You can articulate that zero-padding adds no new information — it just samples the DTFT more densely
Z-transform and transfer functions
- You can show with a difference equation that \(z^{-1}\) corresponds to a one-sample delay
- You can state the BIBO-stability condition: all poles strictly inside the unit circle
- You can geometrically interpret \(H(e^{j\omega})\) in terms of distances from poles and zeros
Autocorrelation and DCT
- You can instantly say “the Fourier transform of the ACF equals the PSD (Wiener–Khinchin)”
- You can articulate the difference between ACF and CCF (the latter being for delay estimation)
- You can summarize in one line why DCT outperforms DFT for compression (even-symmetric extension → no boundary Gibbs)
8. Common Stumbling Blocks — Q&A
Q1. What is the intuition behind the sampling theorem?
The intuition: “Components that oscillate faster than the sample interval are indistinguishable from slower ones if you look only at the samples.” In the frequency domain, the spectrum is replicated every \(f_s\) across the entire frequency axis, so as long as the replicas do not overlap (i.e., \(f_s > 2 f_{\max}\) ), an ideal LPF can pull out a single copy. Equations and figures are in https://yuhi-sa.github.io/en/posts/20260430_sampling_theorem/1/.
Q2. What is the difference between DTFT, DFT, and FFT?
- DTFT: discrete in time, continuous in frequency (theoretical use)
- DFT: discrete and finite in both time and frequency (numerical use)
- FFT: an algorithm that computes the DFT quickly (the output is identical to a DFT)
See https://yuhi-sa.github.io/en/posts/20260505_dtft_dft_fft/1/ for full detail.
Q3. What is the relationship between the Z-transform and the Fourier transform?
The DTFT is the Z-transform \(X(z)\) restricted to the unit circle \(z = e^{j\omega}\) . Conversely, the Z-transform is the analytic continuation of the DTFT into the complex \(z\) -plane — viewed this way, the stability condition (poles inside the unit circle) drops out naturally. See https://yuhi-sa.github.io/en/posts/20260430_z_transform/1/.
Q4. What is the difference between autocorrelation and cross-correlation?
- ACF: similarity between a signal and a delayed copy of itself → periodicity detection
- CCF: similarity between two different signals → delay estimation
The ACF attains its maximum at \(\tau = 0\) ; for the CCF, the \(\tau\) at which the maximum occurs is exactly the estimated delay. See https://yuhi-sa.github.io/en/posts/20260429_autocorrelation/1/.
Q5. DCT or DFT — which should I use?
If your input is real-valued and you want to concentrate energy in the low-order coefficients (i.e., compress), use the DCT. If you need a complex spectrum or a frequency response, use the DFT/FFT. Internally the DCT is computed via an even-symmetric extension plus an FFT, so the asymptotic cost is the same \(O(N \log N)\) . Details in https://yuhi-sa.github.io/en/posts/20260430_dct/1/.
Q6. Is sinc interpolation usable in practice?
The ideal sinc is an infinite sum, so in practice you truncate to a finite length and multiply by a window function. There is a trade-off between truncation error and window side-lobes. In real code, prefer scipy.signal.resample (FFT-equivalent) or resample_poly (polyphase). See https://yuhi-sa.github.io/en/posts/20260430_signal_interpolation/1/.
Q7. I always get confused by the FFT frequency axis.
Always use np.fft.fftfreq(N, d=1/fs) or np.fft.rfftfreq(N, d=1/fs). Writing it out by hand is error-prone — signs and ordering are easy to get wrong. Window functions and PSD units (including normalization) are organized in https://yuhi-sa.github.io/en/posts/20260228_fft_window_psd/1/.
9. Related Hubs and Articles
The six articles bundled by this hub
- https://yuhi-sa.github.io/en/posts/20260430_sampling_theorem/1/ — Sampling theorem
- https://yuhi-sa.github.io/en/posts/20260430_signal_interpolation/1/ — Signal interpolation
- https://yuhi-sa.github.io/en/posts/20260505_dtft_dft_fft/1/ — DTFT/DFT/FFT
- https://yuhi-sa.github.io/en/posts/20260430_z_transform/1/ — Z-transform
- https://yuhi-sa.github.io/en/posts/20260429_autocorrelation/1/ — Autocorrelation
- https://yuhi-sa.github.io/en/posts/20260430_dct/1/ — DCT
Connected hubs
- https://yuhi-sa.github.io/en/posts/20260522_filter_design_guide/1/ — Filter-design guide hub
- https://yuhi-sa.github.io/en/posts/20260524_time_frequency_guide/1/ — Time-frequency analysis hub
- https://yuhi-sa.github.io/en/posts/20260525_ml_timeseries_guide/1/ — Machine-learning time-series hub
- https://yuhi-sa.github.io/en/posts/20260528_dsp_ml_roadmap/1/ — DSP/ML meta-roadmap
Supporting articles
- https://yuhi-sa.github.io/en/posts/20260225_fft/1/ — FFT primer
- https://yuhi-sa.github.io/en/posts/20260228_fft_window_psd/1/ — Window functions and PSD
- https://yuhi-sa.github.io/en/posts/20260502_convolution_correlation/1/ — Convolution and correlation
- https://yuhi-sa.github.io/en/posts/20260430_phase_group_delay/1/ — Phase and group delay
- https://yuhi-sa.github.io/en/posts/20260225_moving_average/1/ — Moving average
Practical follow-up articles
- FFT amplitude scaling and zero-padding — distinguish one-sided factors, window correction, and FFT length.
- Choosing Welch PSD parameters — check segment length, overlap, and PSD units with reproducible examples.
Bridge to integer-algebra algorithms
- https://yuhi-sa.github.io/en/posts/20260614_cryptography_roadmap/1/ — Cryptography roadmap hub. The math used in discrete DSP — complex exponentials \(e^{j\omega n}\) , binary exponentiation, cyclic structure — appears verbatim as integer arithmetic on \(\mathbb{Z}/N\mathbb{Z}\) inside cryptographic algorithms (RSA, DH, ElGamal). The \(O(\log N)\) binary exponentiation that powers fast modular operations in DSP is the same kernel as fast \(a^k \bmod p\) at the heart of public-key cryptography, making this a natural next step after the discrete DSP basics.
The fundamentals of discrete signal processing are the launchpad for filter design, time-frequency analysis, and machine-learning time series alike. Use this hub as a base camp and head into whichever direction your goals point to.