MatplotlibとNumpyを使って、3次元データを可視化し、それをアニメーション(GIF画像)として保存する方法を紹介します。時系列で変化する3Dデータを表現する際に非常に有効です。
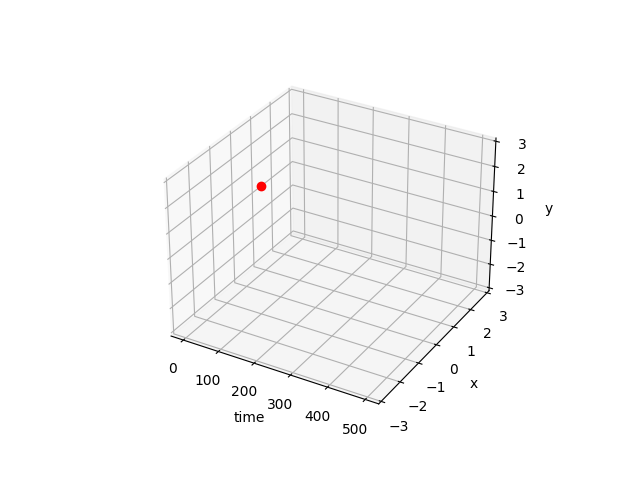
作成されるGIF画像
コード
import numpy as np
import matplotlib.pyplot as plt
import matplotlib.animation as animation
from mpl_toolkits.mplot3d import Axes3D # 3Dプロットのために必要

def make_animation(data_frames, filename="animation.gif"):
    """
    3Dデータをアニメーション(GIF)として作成し保存する関数。

    :param data_frames: 各フレームの3D座標 (X, Y, Z) のリスト。
                        例: [[X_frame1, Y_frame1, Z_frame1], [X_frame2, Y_frame2, Z_frame2], ...]
    :param filename: 保存するGIFファイルのパス。
    """
    print("フレームを生成中...")

    fig = plt.figure(figsize=(8, 6)) # 図のサイズを指定
    ax = fig.add_subplot(111, projection='3d')

    # 軸ラベルの設定
    ax.set_xlabel('X-axis')
    ax.set_ylabel('Y-axis')
    ax.set_zlabel('Z-axis')

    # 軸の範囲をデータに合わせて自動調整、または手動で設定
    # ax.set_xlim(-500, 500) # 例
    # ax.set_ylim(-3, 3)
    # ax.set_zlim(-3, 3)

    ims = [] # 各フレームのArtistオブジェクトを格納するリスト

    for i, (X, Y, Z) in enumerate(data_frames):
        # プログレスバー表示
        progress = (i + 1) * 100 / len(data_frames)
        print(f"\r進捗: {progress:.1f}%", end="")

        # 3Dプロット。marker='o' で点を表示、linestyle='None' で線を表示しない
        # im = ax.plot(X, Y, Z, marker="o", color="red", linestyle='None')
        # plot()はリストを返すので、ims.append(im[0])のように要素を取り出す
        im, = ax.plot(X, Y, Z, marker="o", color="red", linestyle='None') # カンマでアンパック

        ims.append([im]) # ArtistAnimationはリストのリストを期待する

    print("\nアニメーションを生成中...")

    # アニメーションの作成
    # fig: アニメーションの対象となるFigureオブジェクト
    # ims: 各フレームのArtistオブジェクトのリスト
    # interval: フレーム間の遅延時間(ミリ秒)
    # blit: Trueにすると、変更された部分のみを再描画し高速化(ただし、複雑な3Dプロットでは問題を起こす可能性あり)
    ani = animation.ArtistAnimation(fig, ims, interval=50, blit=False)

    # アニメーションの保存
    # writer: アニメーションを保存するためのライター。'ffmpeg' や 'imagemagick' などが必要になる場合がある。
    # fps: フレーム/秒
    ani.save(filename, writer='pillow', fps=20) # 'pillow' は追加のライブラリ不要でGIF保存可能

    print(f"アニメーションを {filename} に保存しました。")
    plt.show() # アニメーションを表示

def main():
    # サンプルデータの生成
    # 時刻tに応じてsin波とcos波が変化する3D軌跡
    t = np.linspace(0, 20 * np.pi, 500) # 0から20πまで500点

    data_frames = []
    for i in range(len(t)):
        # 各フレームで1点だけプロットする例
        X_val = t[i] / (20 * np.pi) * 5 # X軸は時間経過で変化
        Y_val = np.sin(t[i])
        Z_val = np.cos(t[i])
        data_frames.append([[X_val], [Y_val], [Z_val]]) # 各要素をリストにする

    make_animation(data_frames, filename="sin_cos_3d_animation.gif")

if __name__ == '__main__':
  main()
コードの解説
matplotlib.animation.ArtistAnimation:plot関数が返すArtistオブジェクトのリストを渡すことで、それらのオブジェクトが各フレームで描画されるアニメーションを作成します。fig.add_subplot(111, projection='3d'): 3Dプロットを作成するために必須です。ax.plot(X, Y, Z, ...): 3D空間にデータをプロットします。markerやcolor,linestyleなどで表示をカスタマイズできます。ani.save(filename, writer='pillow', fps=20): アニメーションをGIFファイルとして保存します。writer='pillow': Pillowライブラリを使用してGIFを生成します。別途pip install pillowが必要ですが、ffmpegなどの外部ツールをインストールする必要がないため手軽です。fps: Frames Per Second(1秒あたりのフレーム数)で、アニメーションの速度を調整します。
- プログレスバー:
\rを使って同じ行を上書きすることで、コンソールにプログレスバーを表示しています。
このコードを参考に、様々な3Dデータをアニメーション化して可視化してみてください。
関連記事
- Matplotlib実践Tips:論文品質のグラフを作る - rcParams設定、日本語フォント、カラーマップ選択、ベクター出力など、Matplotlibで論文品質のグラフを作成するためのTipsを紹介しています。
- Pythonでprintの上書きをする方法 - この記事のコードでも使用している
\rによるプログレスバー表示の詳しい解説です。 - Pythonプログレスバー実装ガイド - tqdmやrichを使った、より高機能なプログレスバーの実装方法を紹介しています。
- 指数移動平均(EMA)フィルタの周波数特性 - Matplotlibを使った信号処理の可視化例。フィルタの周波数特性グラフの作成方法を解説しています。
- 高速フーリエ変換(FFT)の原理とPython実装 - Matplotlibを使った周波数スペクトルの可視化を含む、FFTの解説記事です。
関連ツール
- DevToolBox - 開発者向け無料ツール集 - JSON整形、正規表現テスターなど85種類以上の開発者向けツール